The September Compass National Real Estate Insights report reveals a housing market that continues to show resilience amid shifting economic dynamics and evolving buyer behaviors. While some metrics point to cooling trends, others underscore ongoing strength—particularly in pricing and inventory.
Median Home Prices Continue to Rise
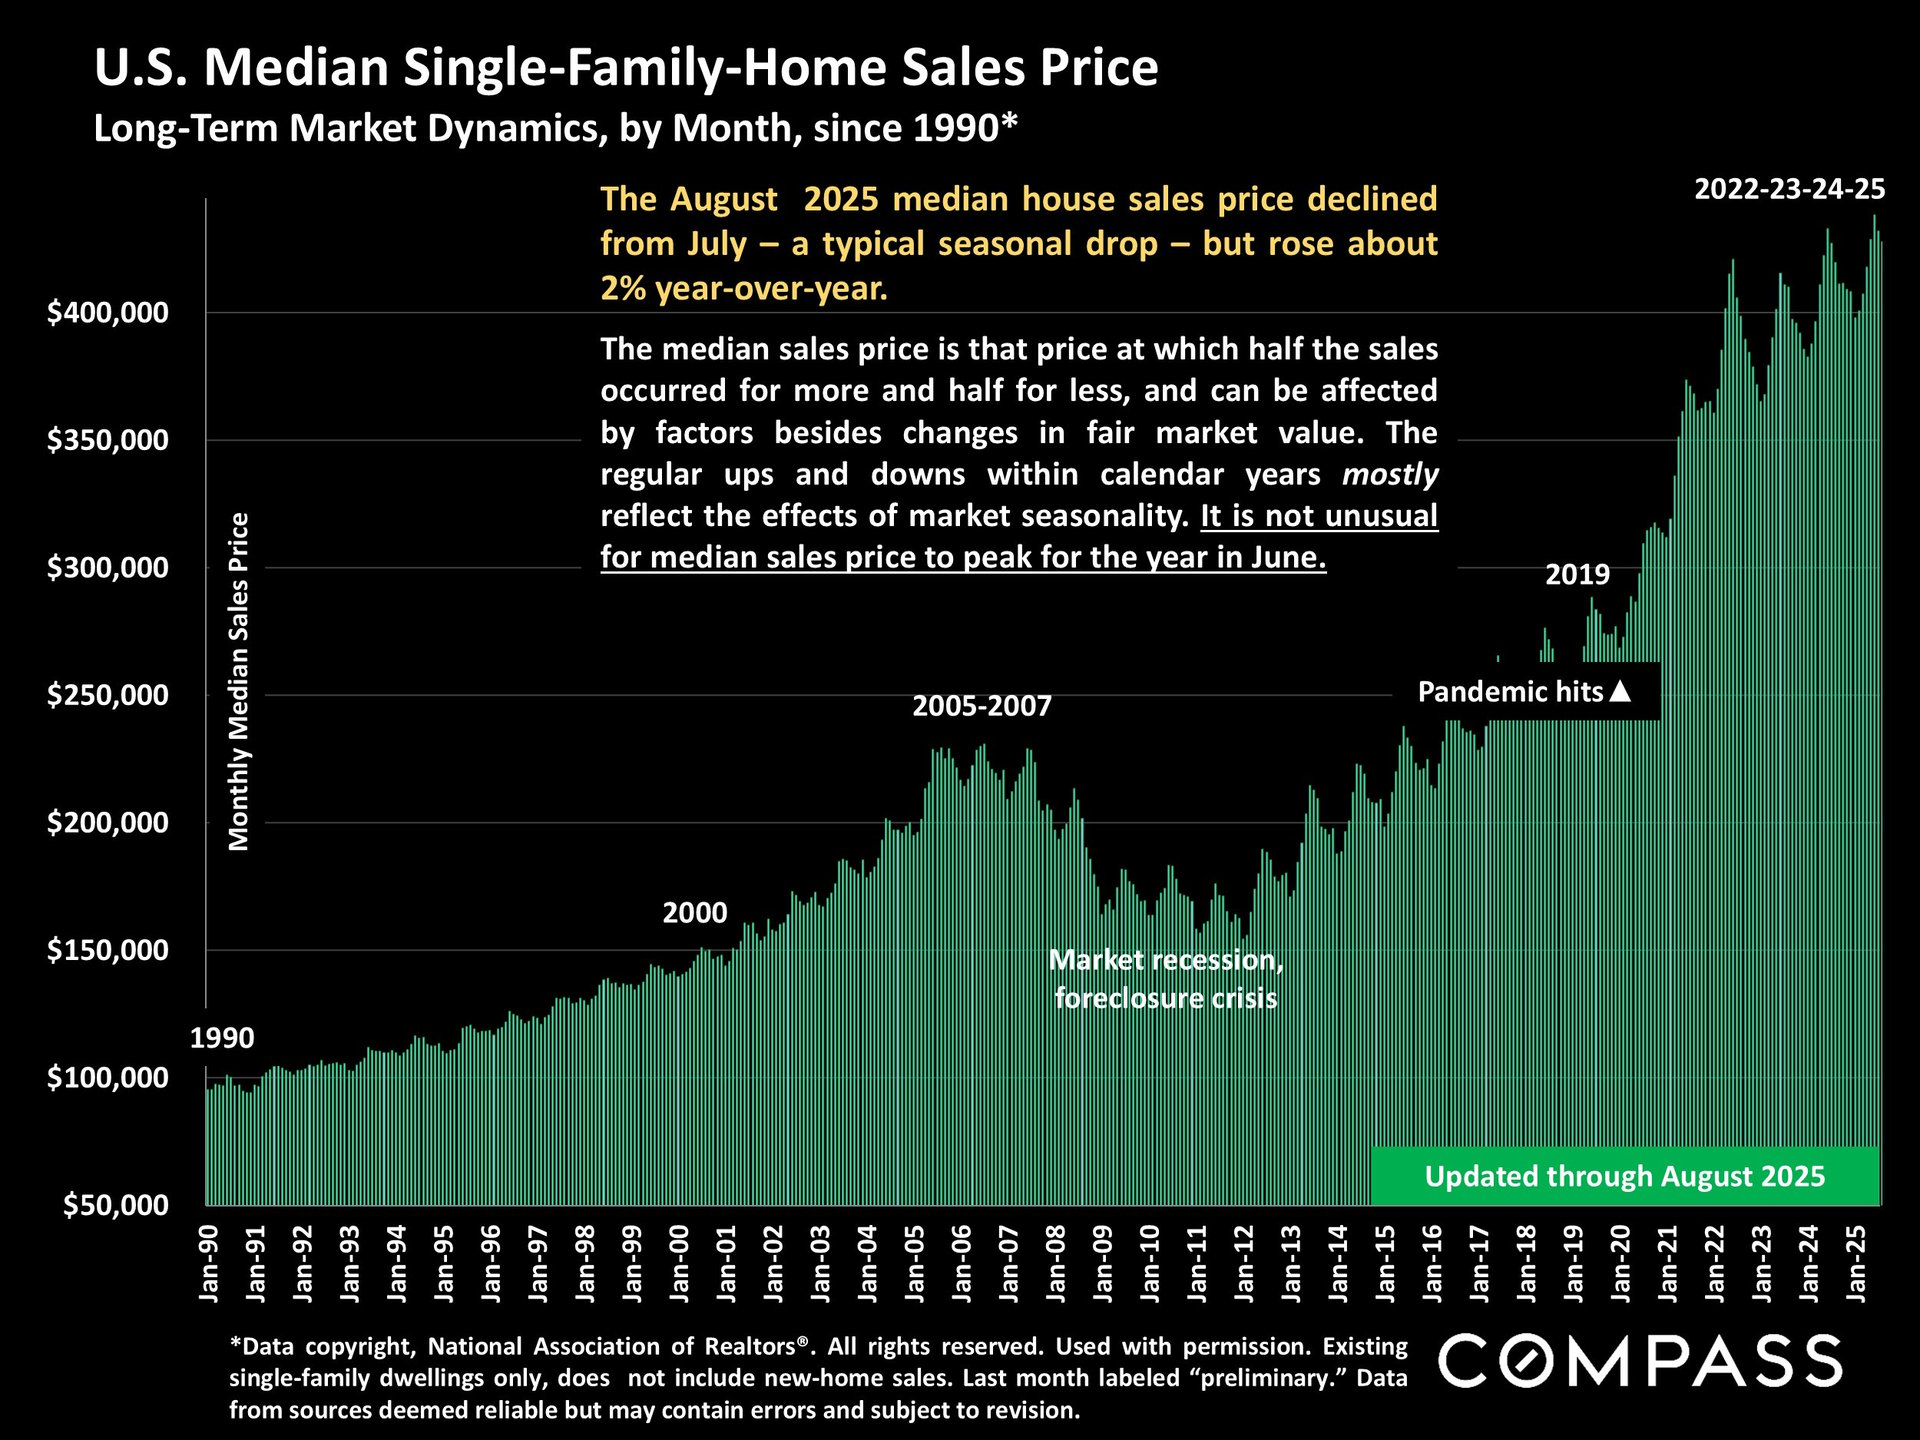
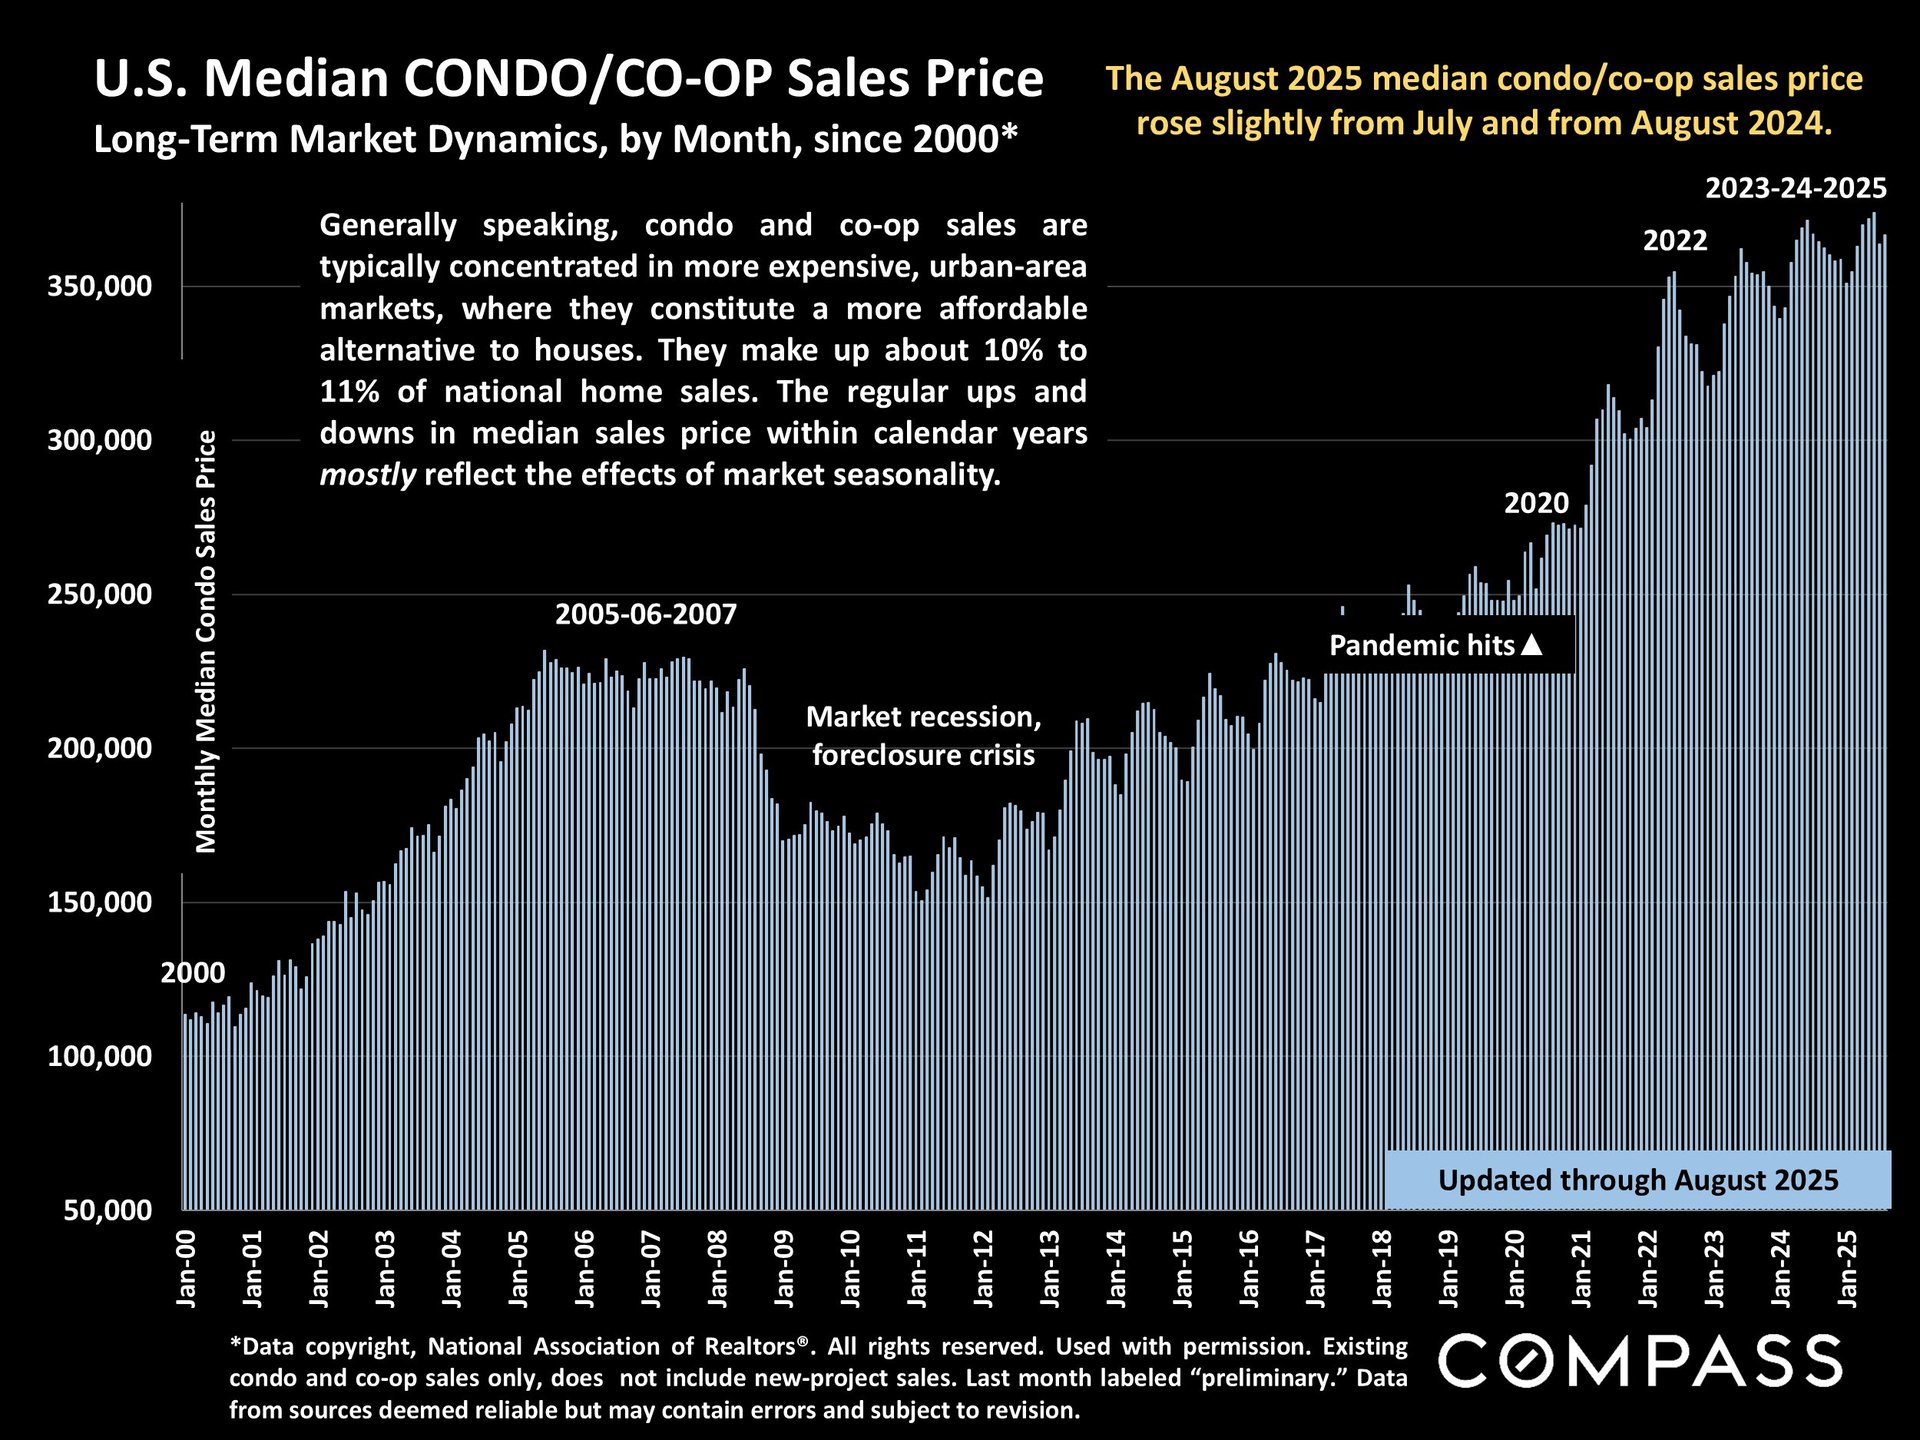
Nationally, both single-family homes and condo/co-op prices continued to rise year-over-year. Beyond the usual appreciation trends, one key driver has been the surge in affluent buyers purchasing higher-end homes. As stock markets soared throughout 2024, demand from this segment intensified, helping lift median sales prices across the country.
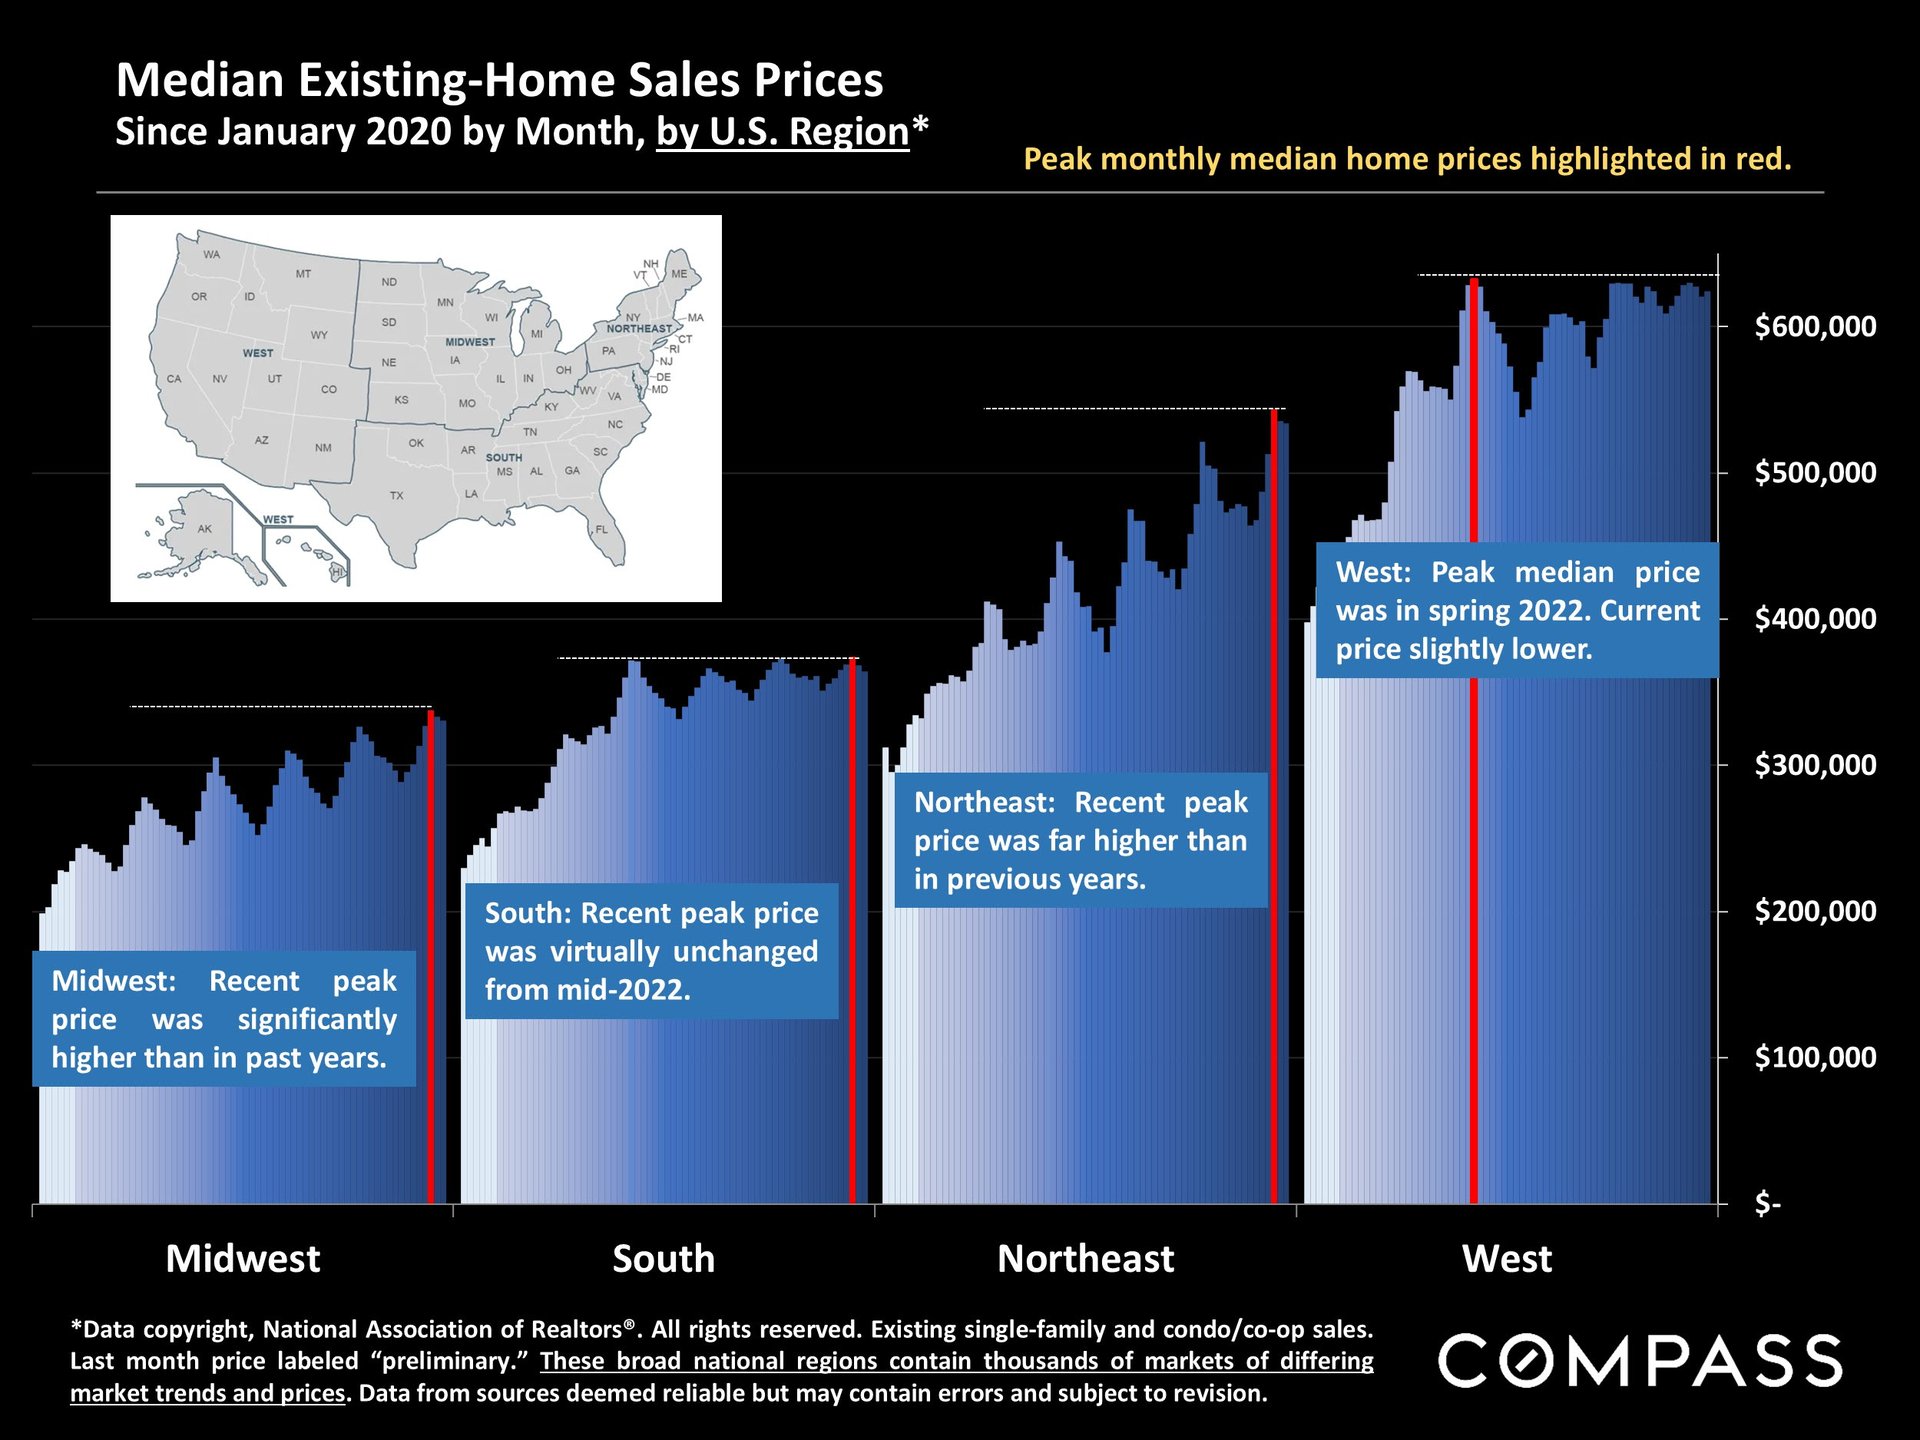
The latest data from the National Association of Realtors highlights regional variations:
-
Midwest and Northeast: Home price appreciation has continued steadily since the peak of the pandemic boom in spring 2022.
-
South and West: After exceptional gains during the pandemic, prices have largely plateaued over the last three years.
These regional differences emphasize the importance of local market expertise—conditions can vary dramatically even within the same state or metro area.
Photos Courtesy of Compass
Inventory on the Rise
After reaching a multi-year high in April 2025, new listings have slowed, though they remain about 5% higher than last August. Overall, the number of homes on the market is now at its highest level since 2019, up 21% year-over-year as of August.
This expanding inventory has created more balance between buyers and sellers. The months-supply-of-inventory (MSI)—a key measure of how long it would take to sell all current listings at the existing sales pace—is now at a six-year high. While this still varies seasonally, it signals a transition toward a more neutral or even buyer-favored market in some areas.
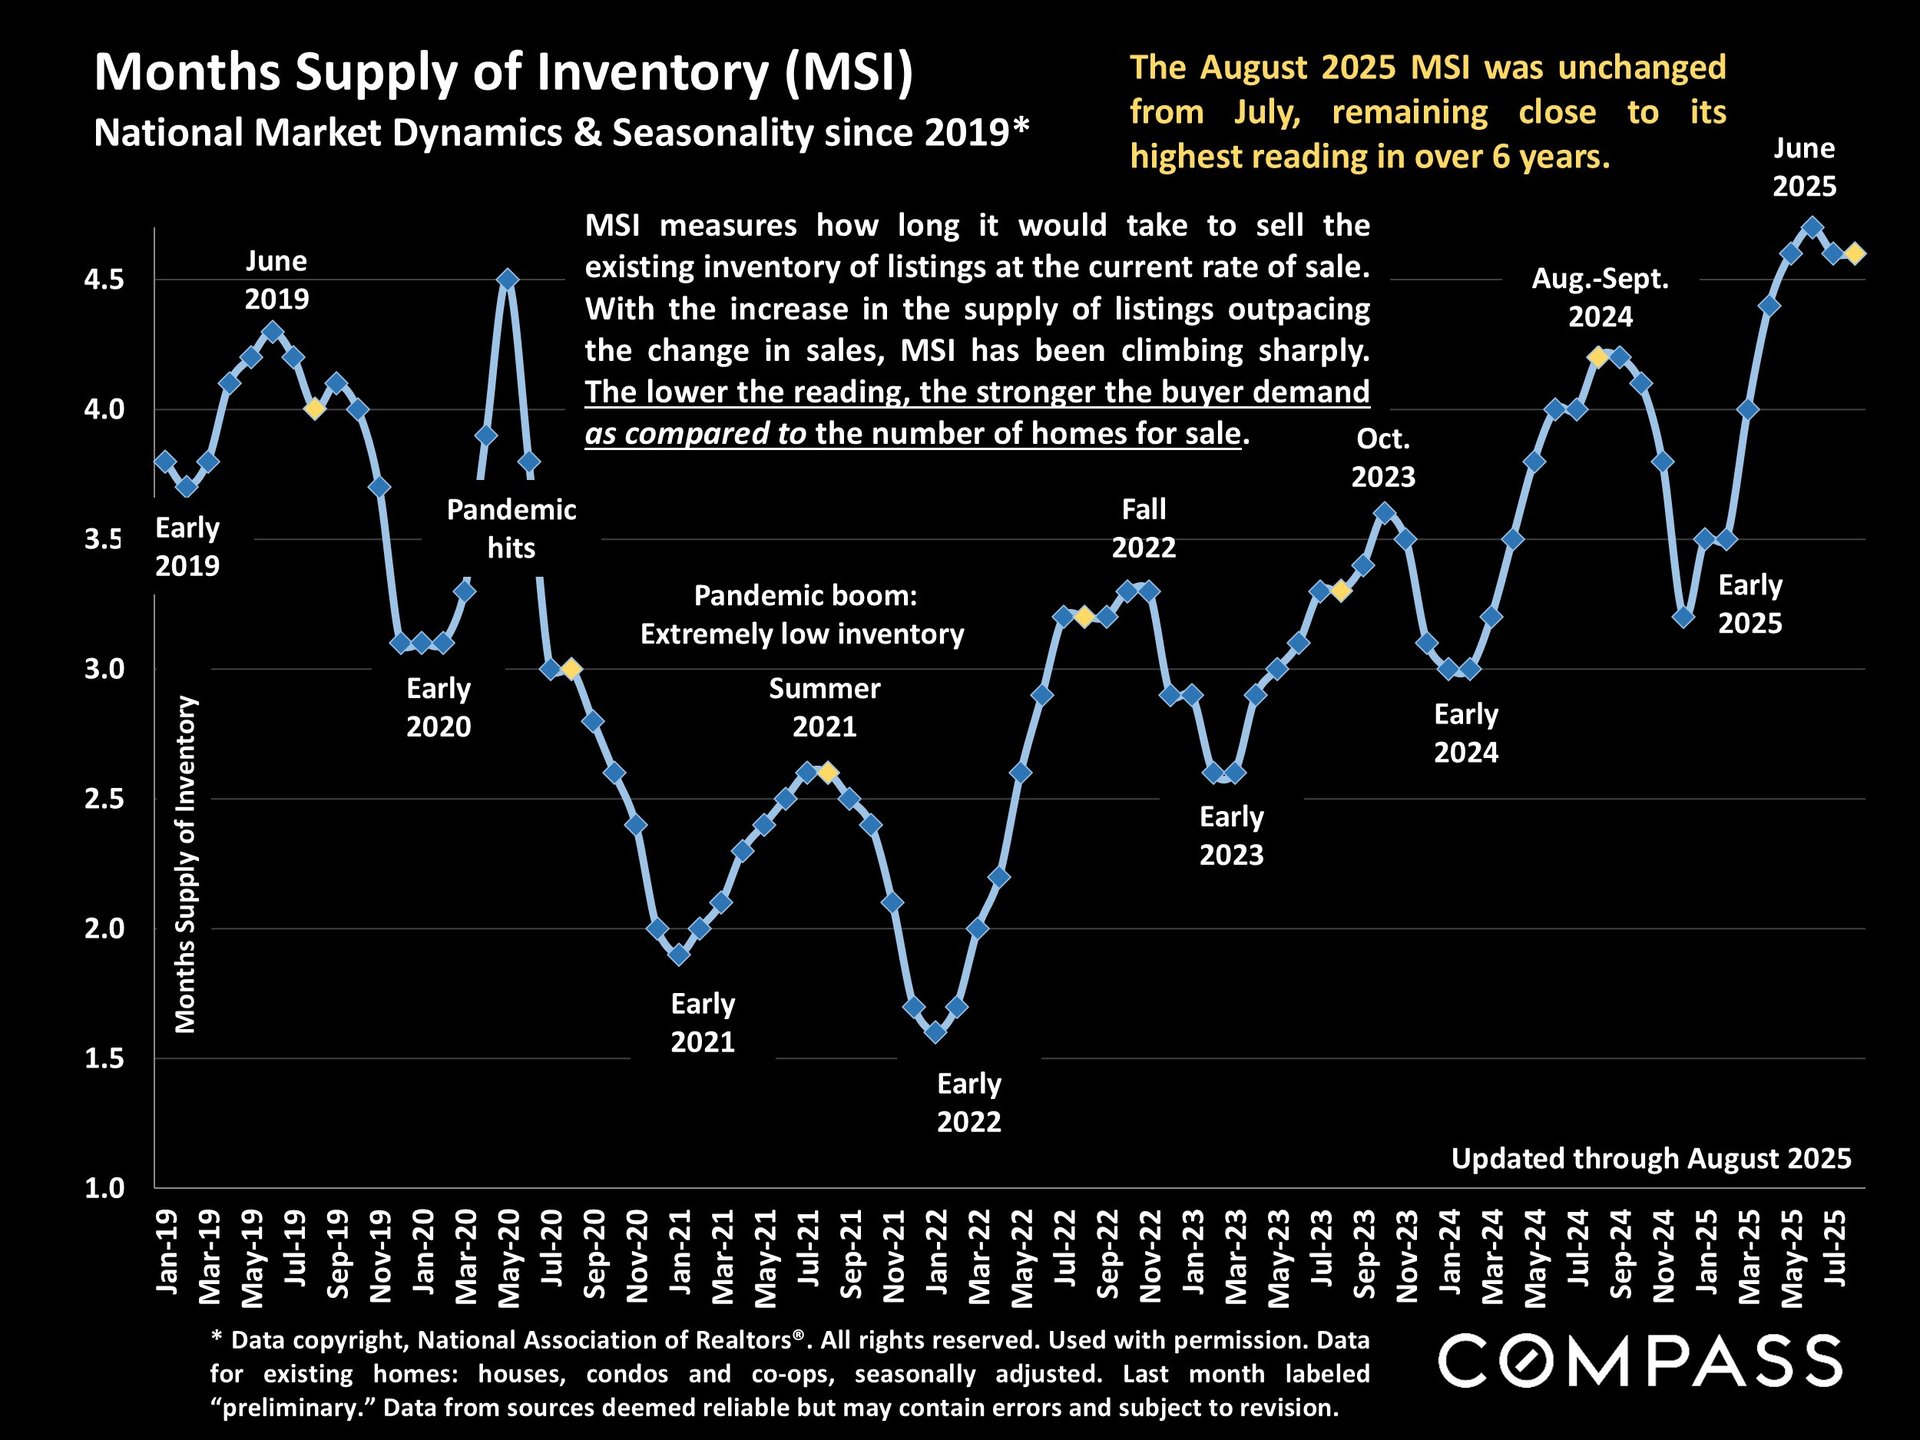
Photo Courtesy of Compass
Sales Volume and Market Cooling Indicators
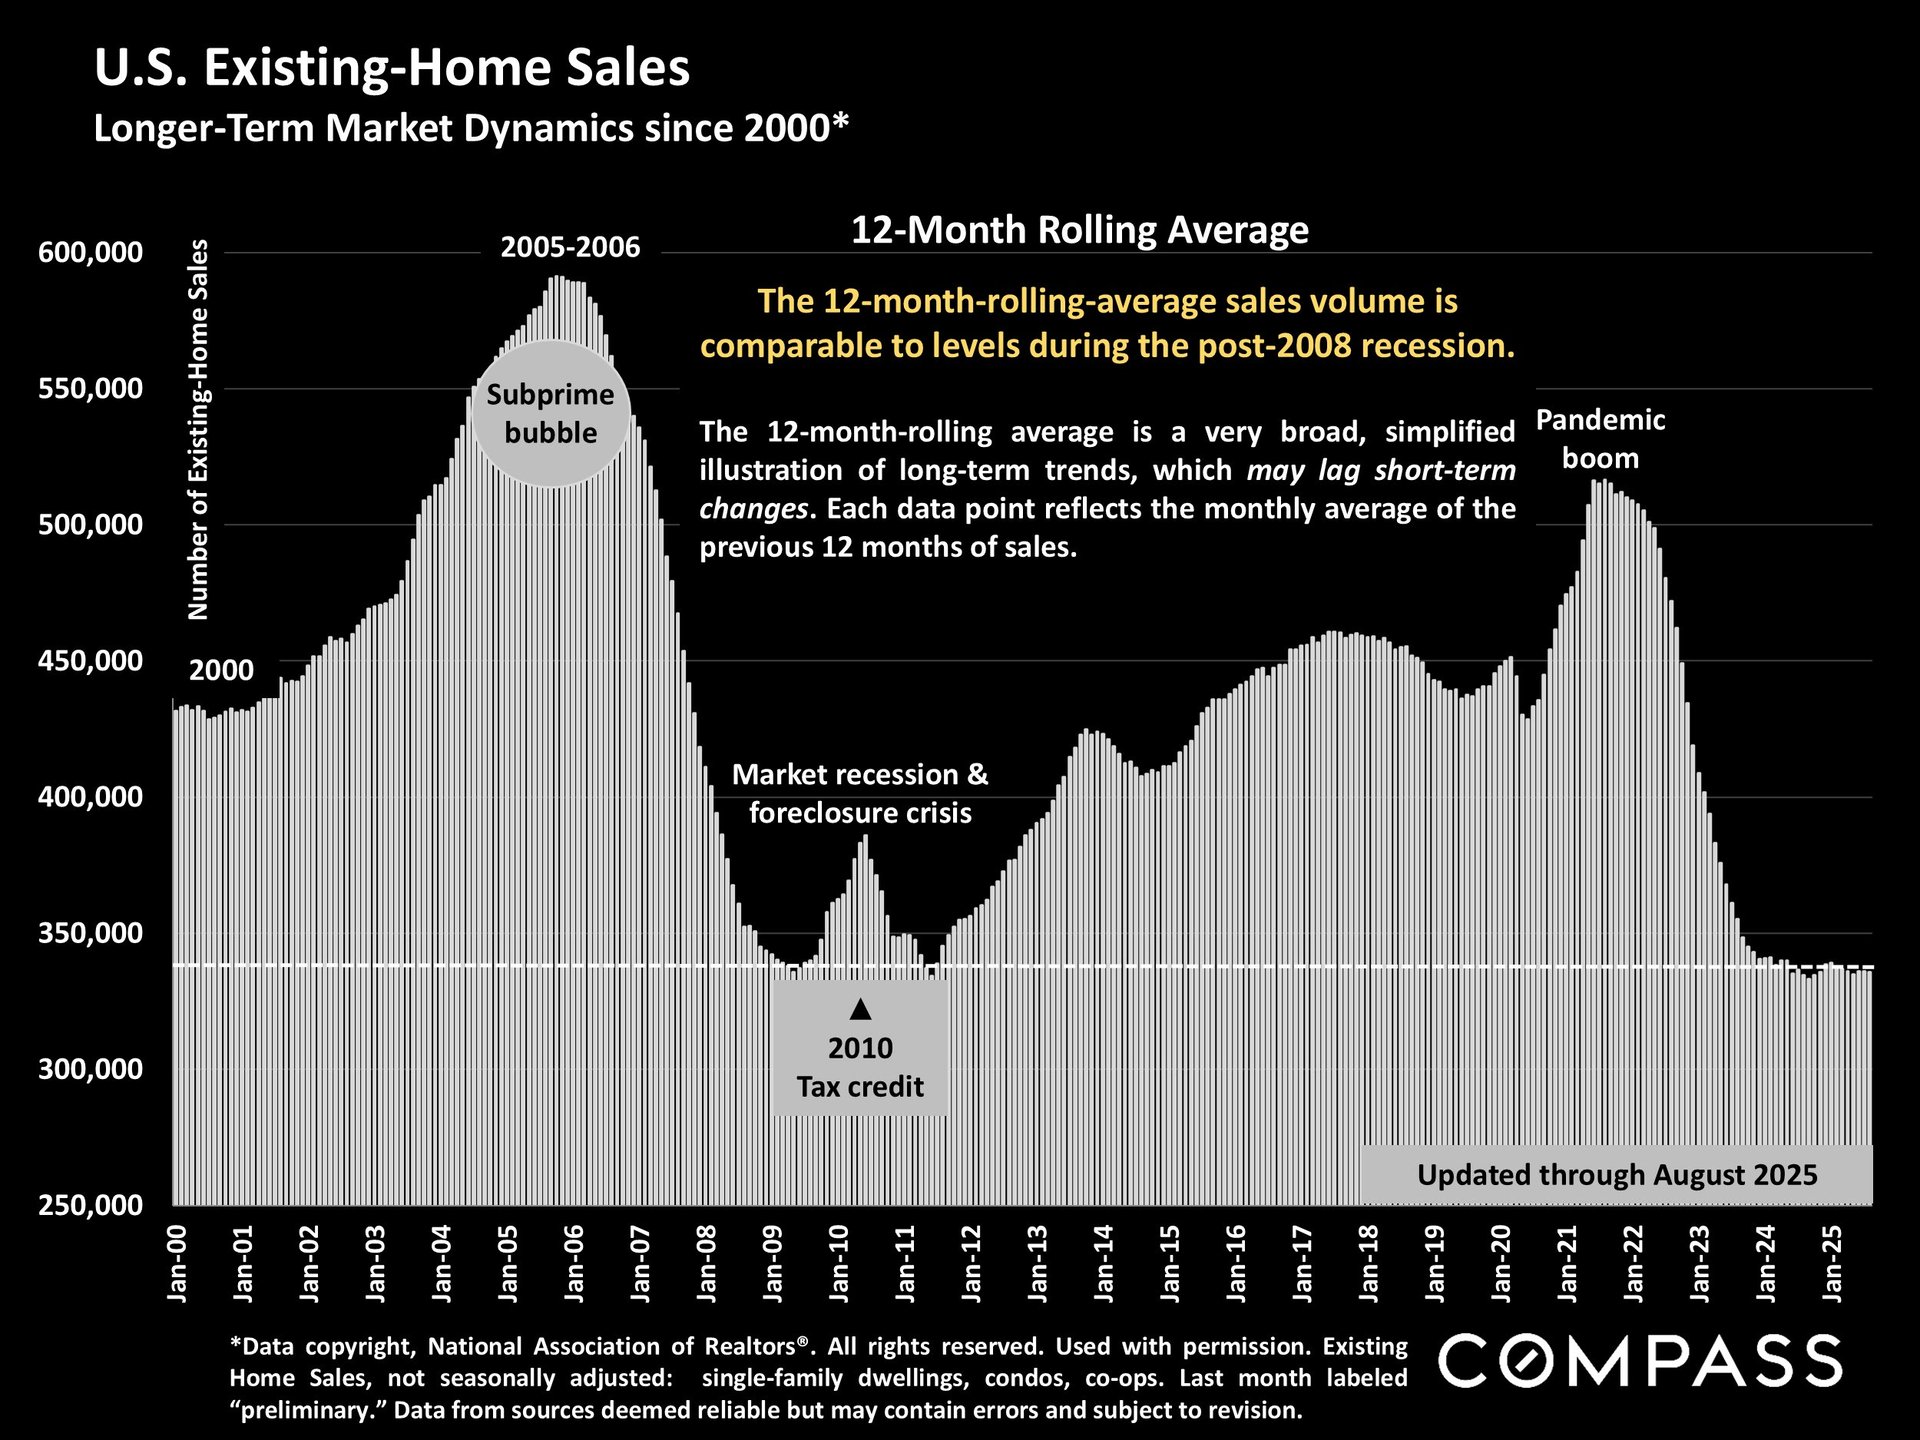
The 12-month rolling average of home sales continues to hover near levels last seen during the Great Recession, reflecting ongoing affordability challenges and cautious consumer sentiment. Yet, it’s important to remember that hundreds of thousands of homes still sell each month, and well-prepared listings can still attract multiple offers and sell quickly.
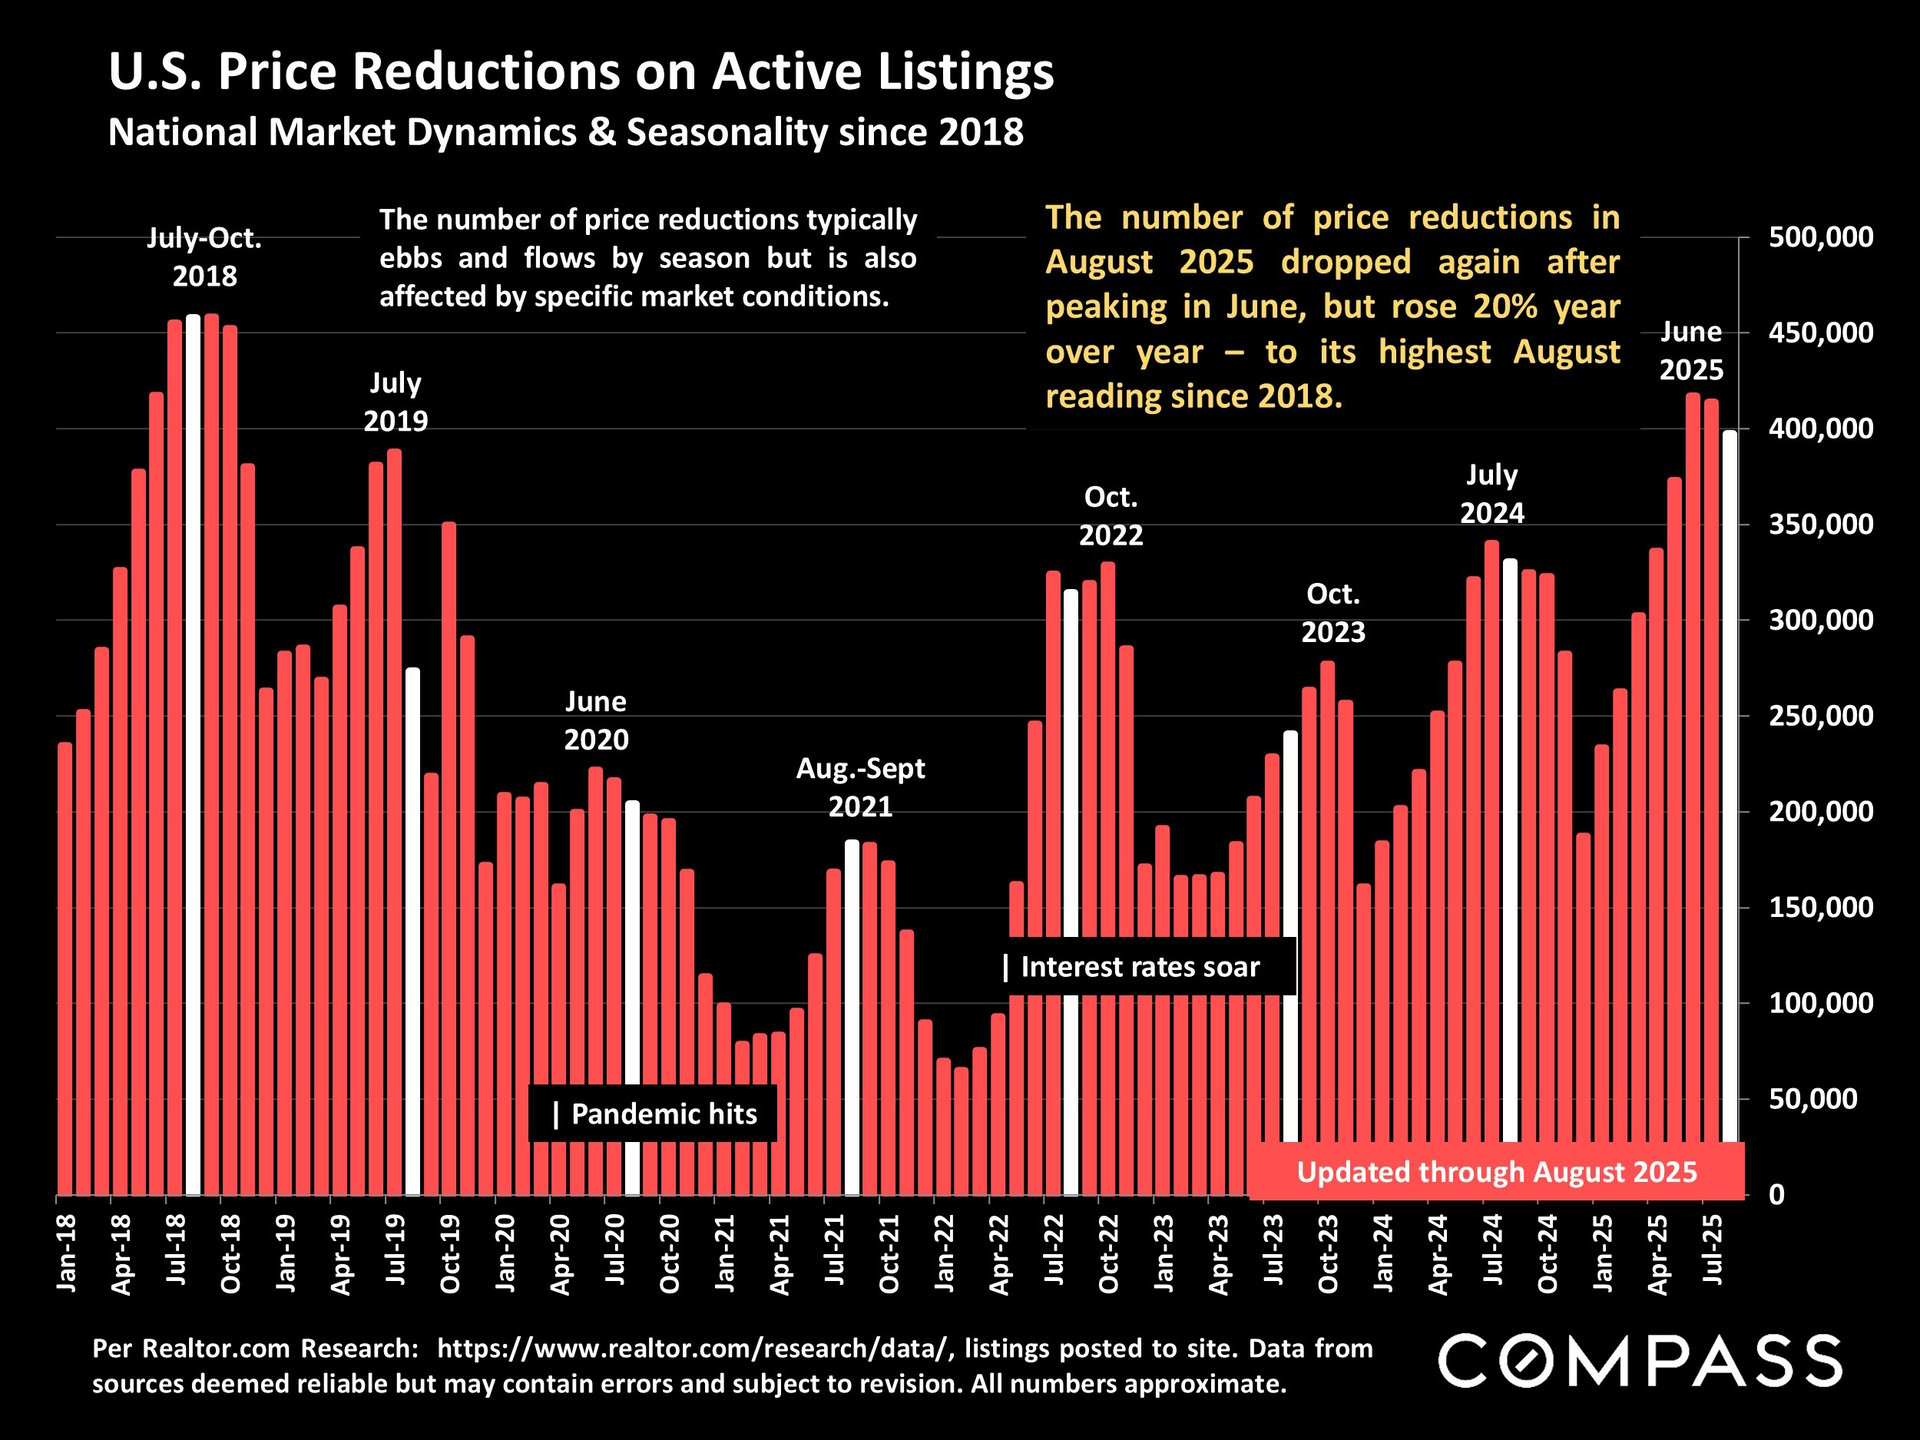
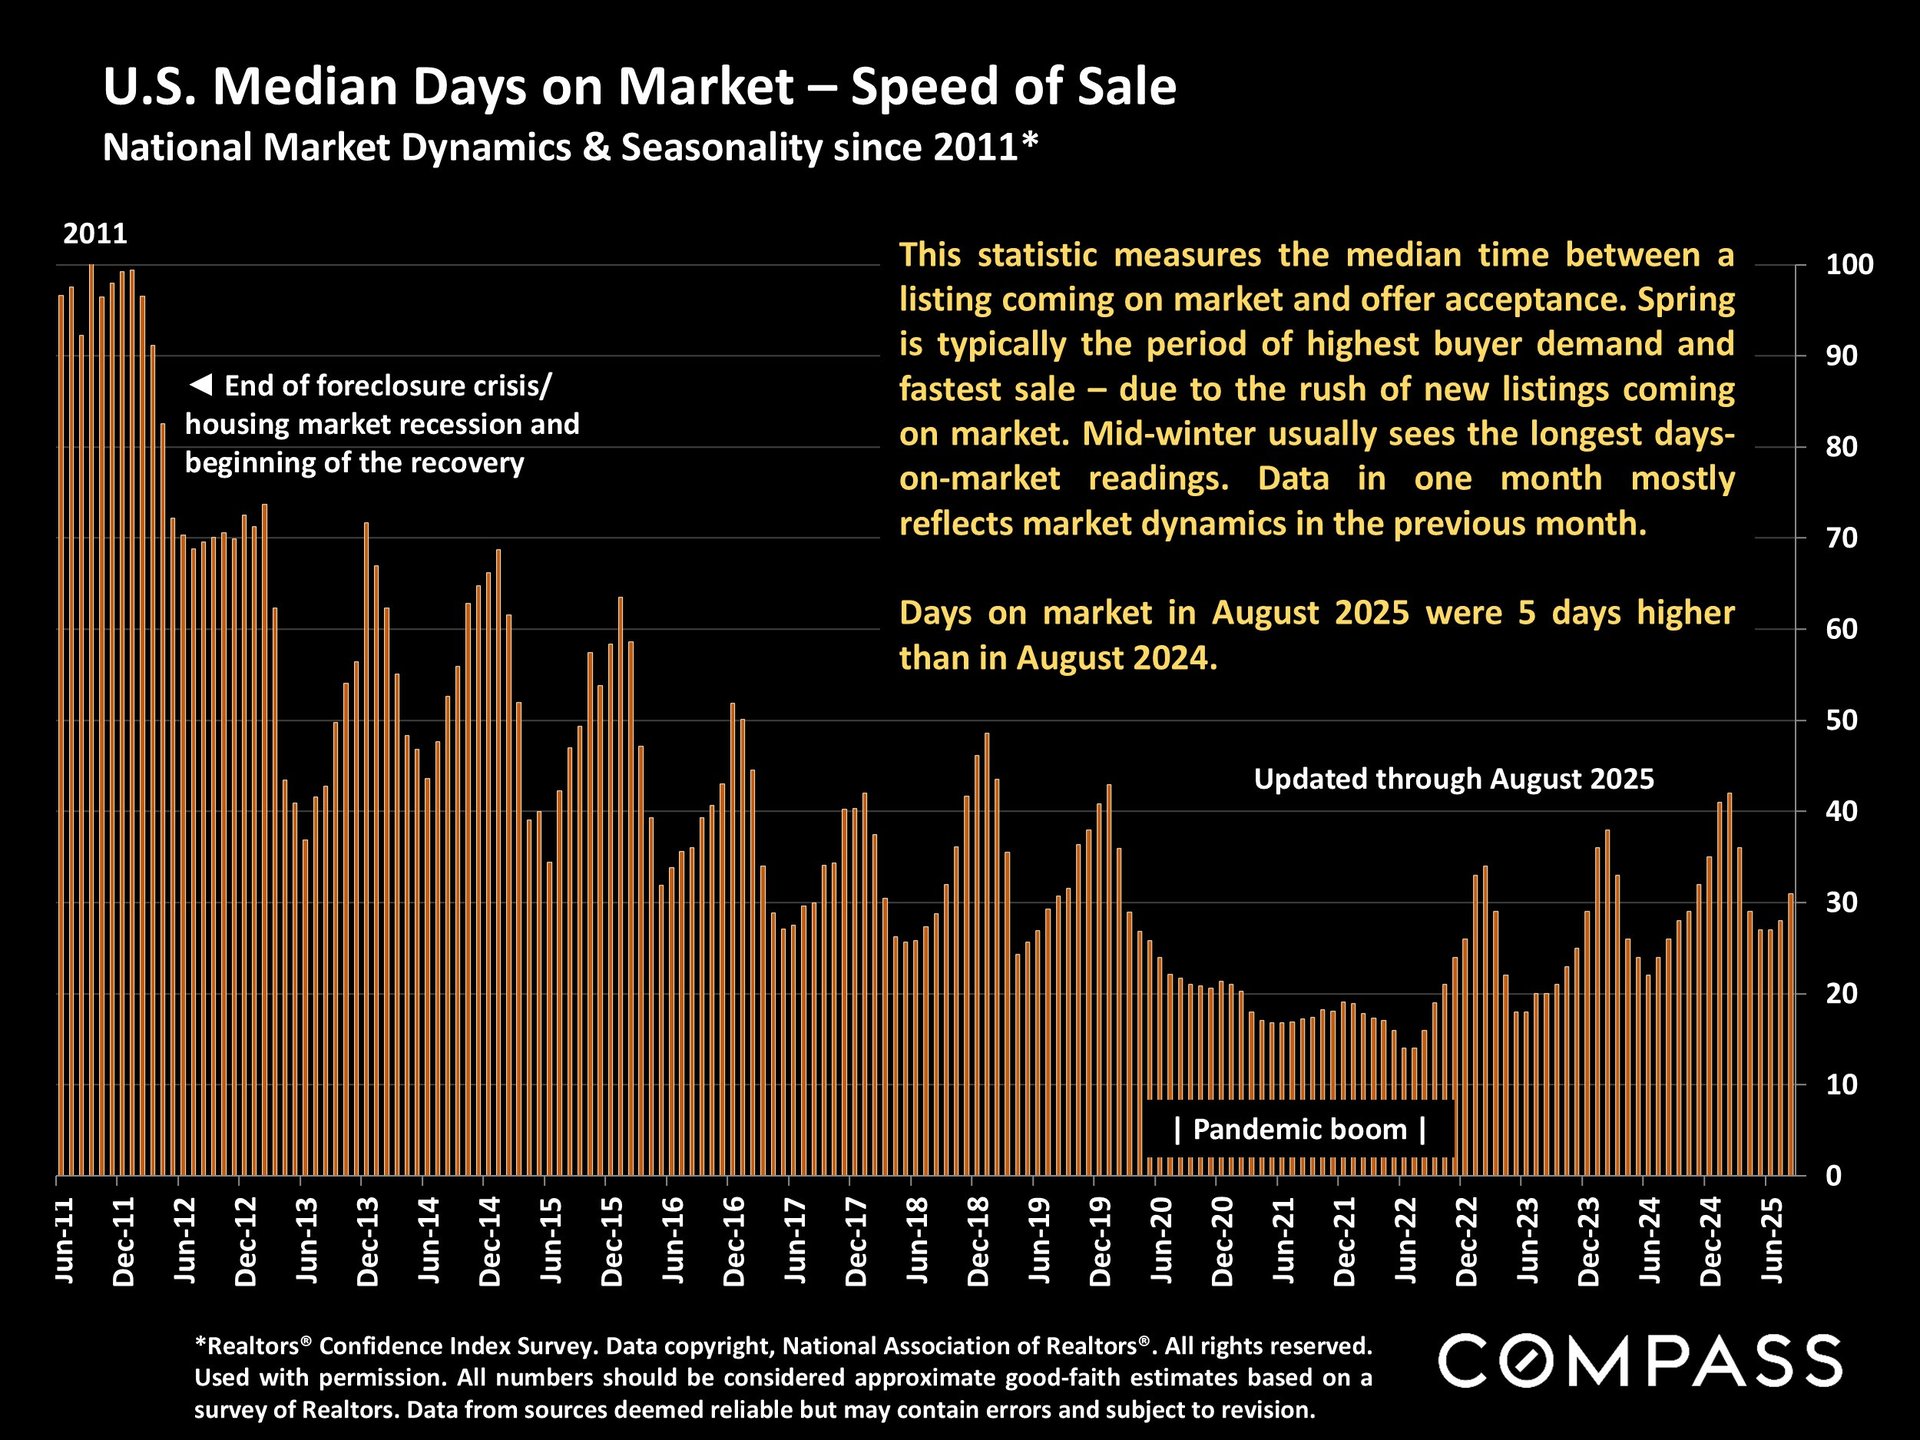
Signs of a cooling market are becoming clearer, however. Both price reductions and days on market have increased year-over-year—two strong indicators that sellers must focus on accurate pricing, strong marketing, and proper home preparation to succeed in today’s environment.
For buyers, these conditions can open the door to opportunity. While the perfect home may appear as a brand-new listing, some of the best values are often found among homes that lingered on the market simply because they were initially overpriced.
Economic Factors to Watch
September also brought notable macroeconomic developments:
-
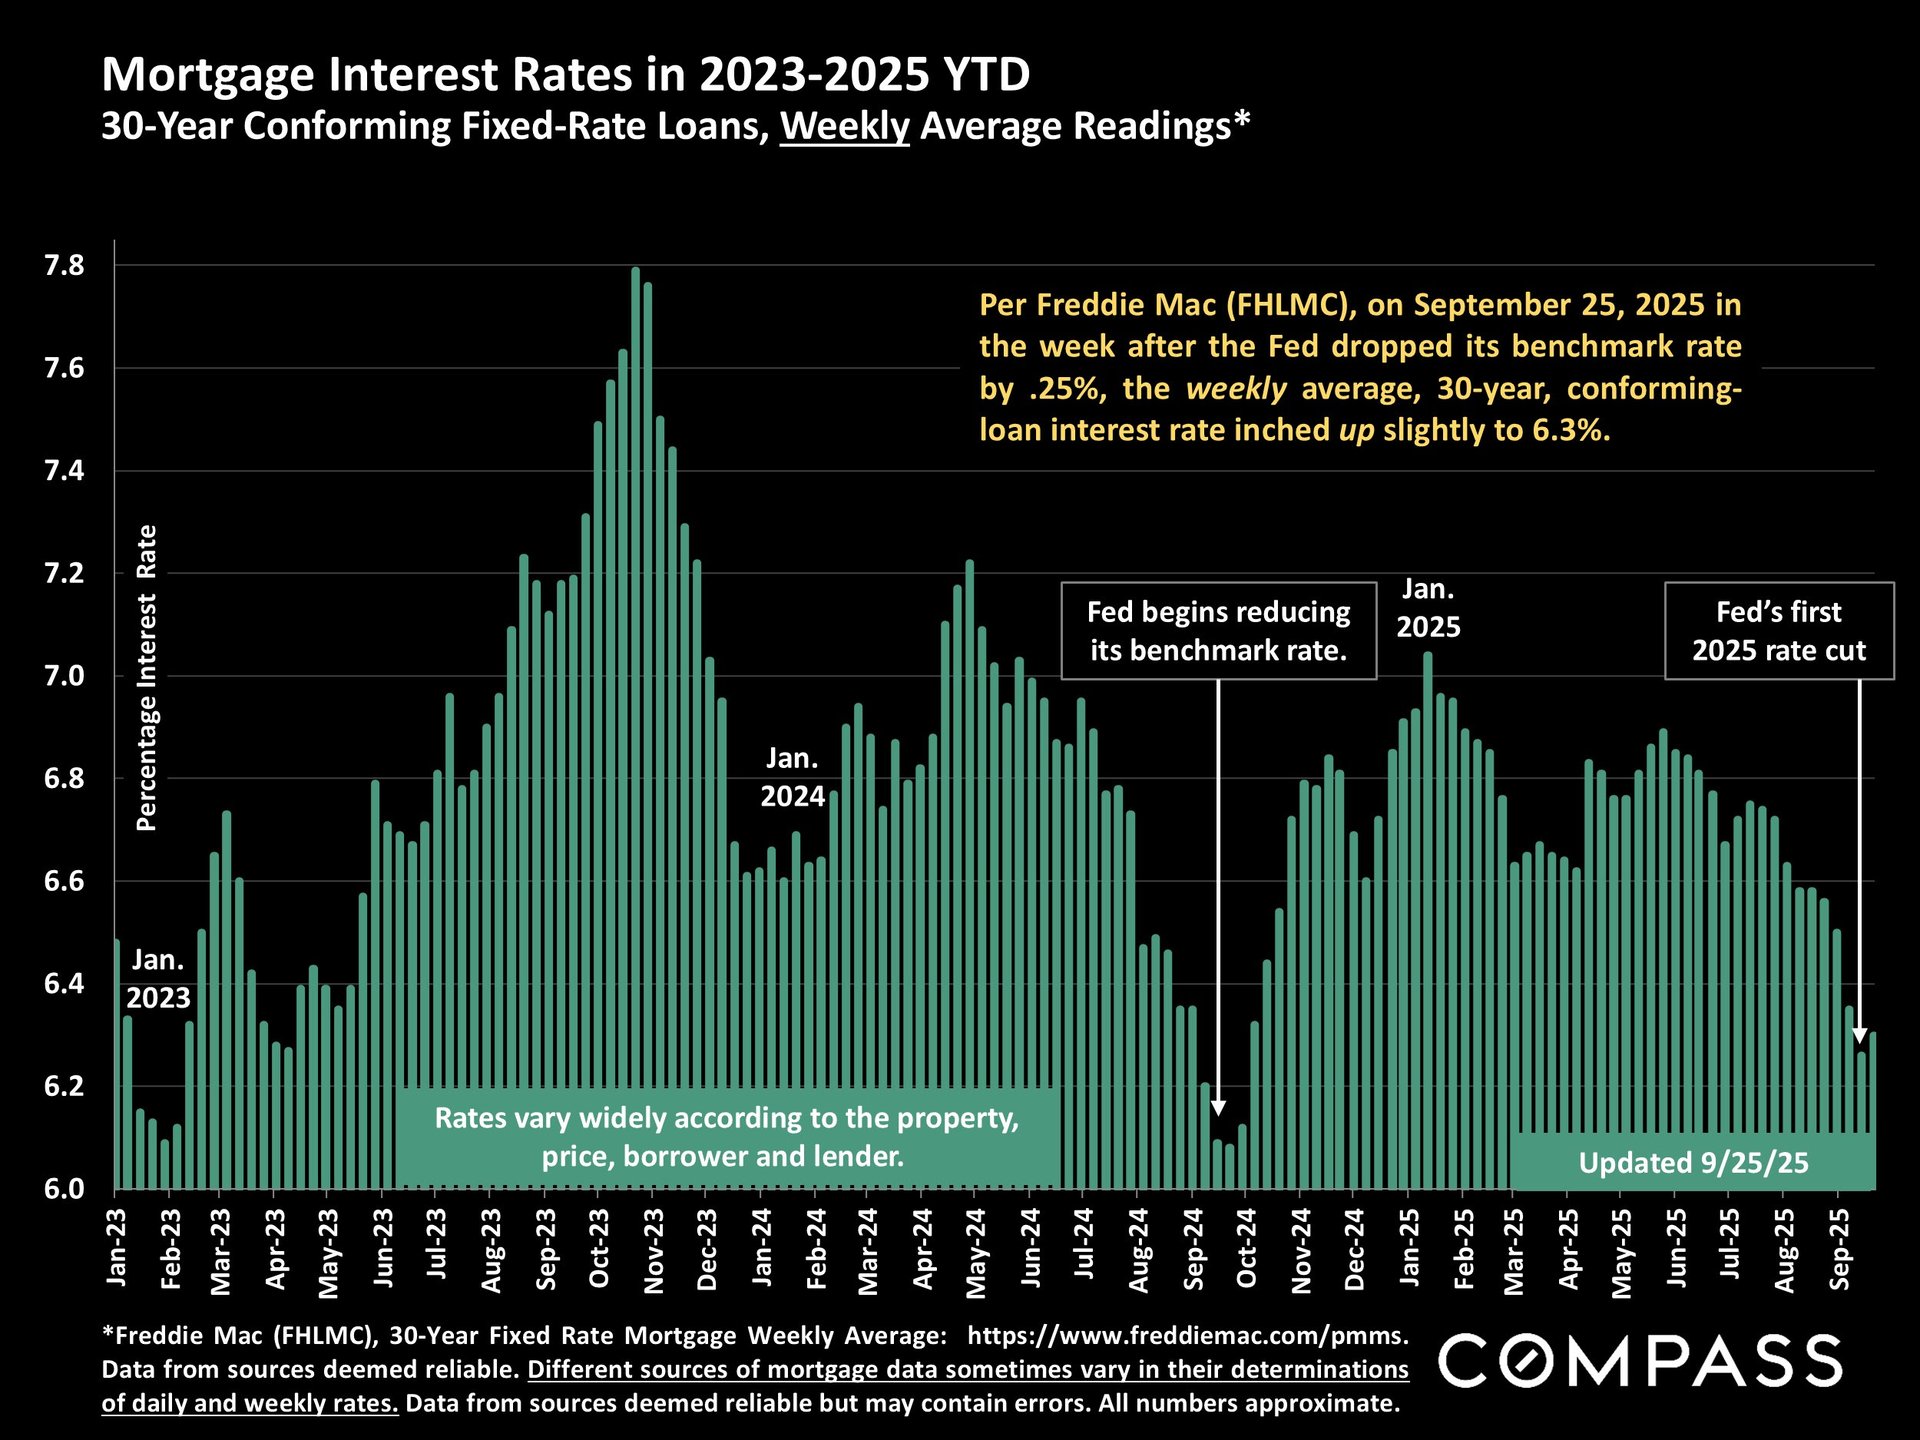
The Federal Reserve reduced its benchmark rate by 0.25%, with analysts expecting additional cuts in the fourth quarter.
-
Despite this move, the average 30-year mortgage rate inched up slightly after the Fed’s September 17th announcement—but remains below earlier 2025 levels.
-
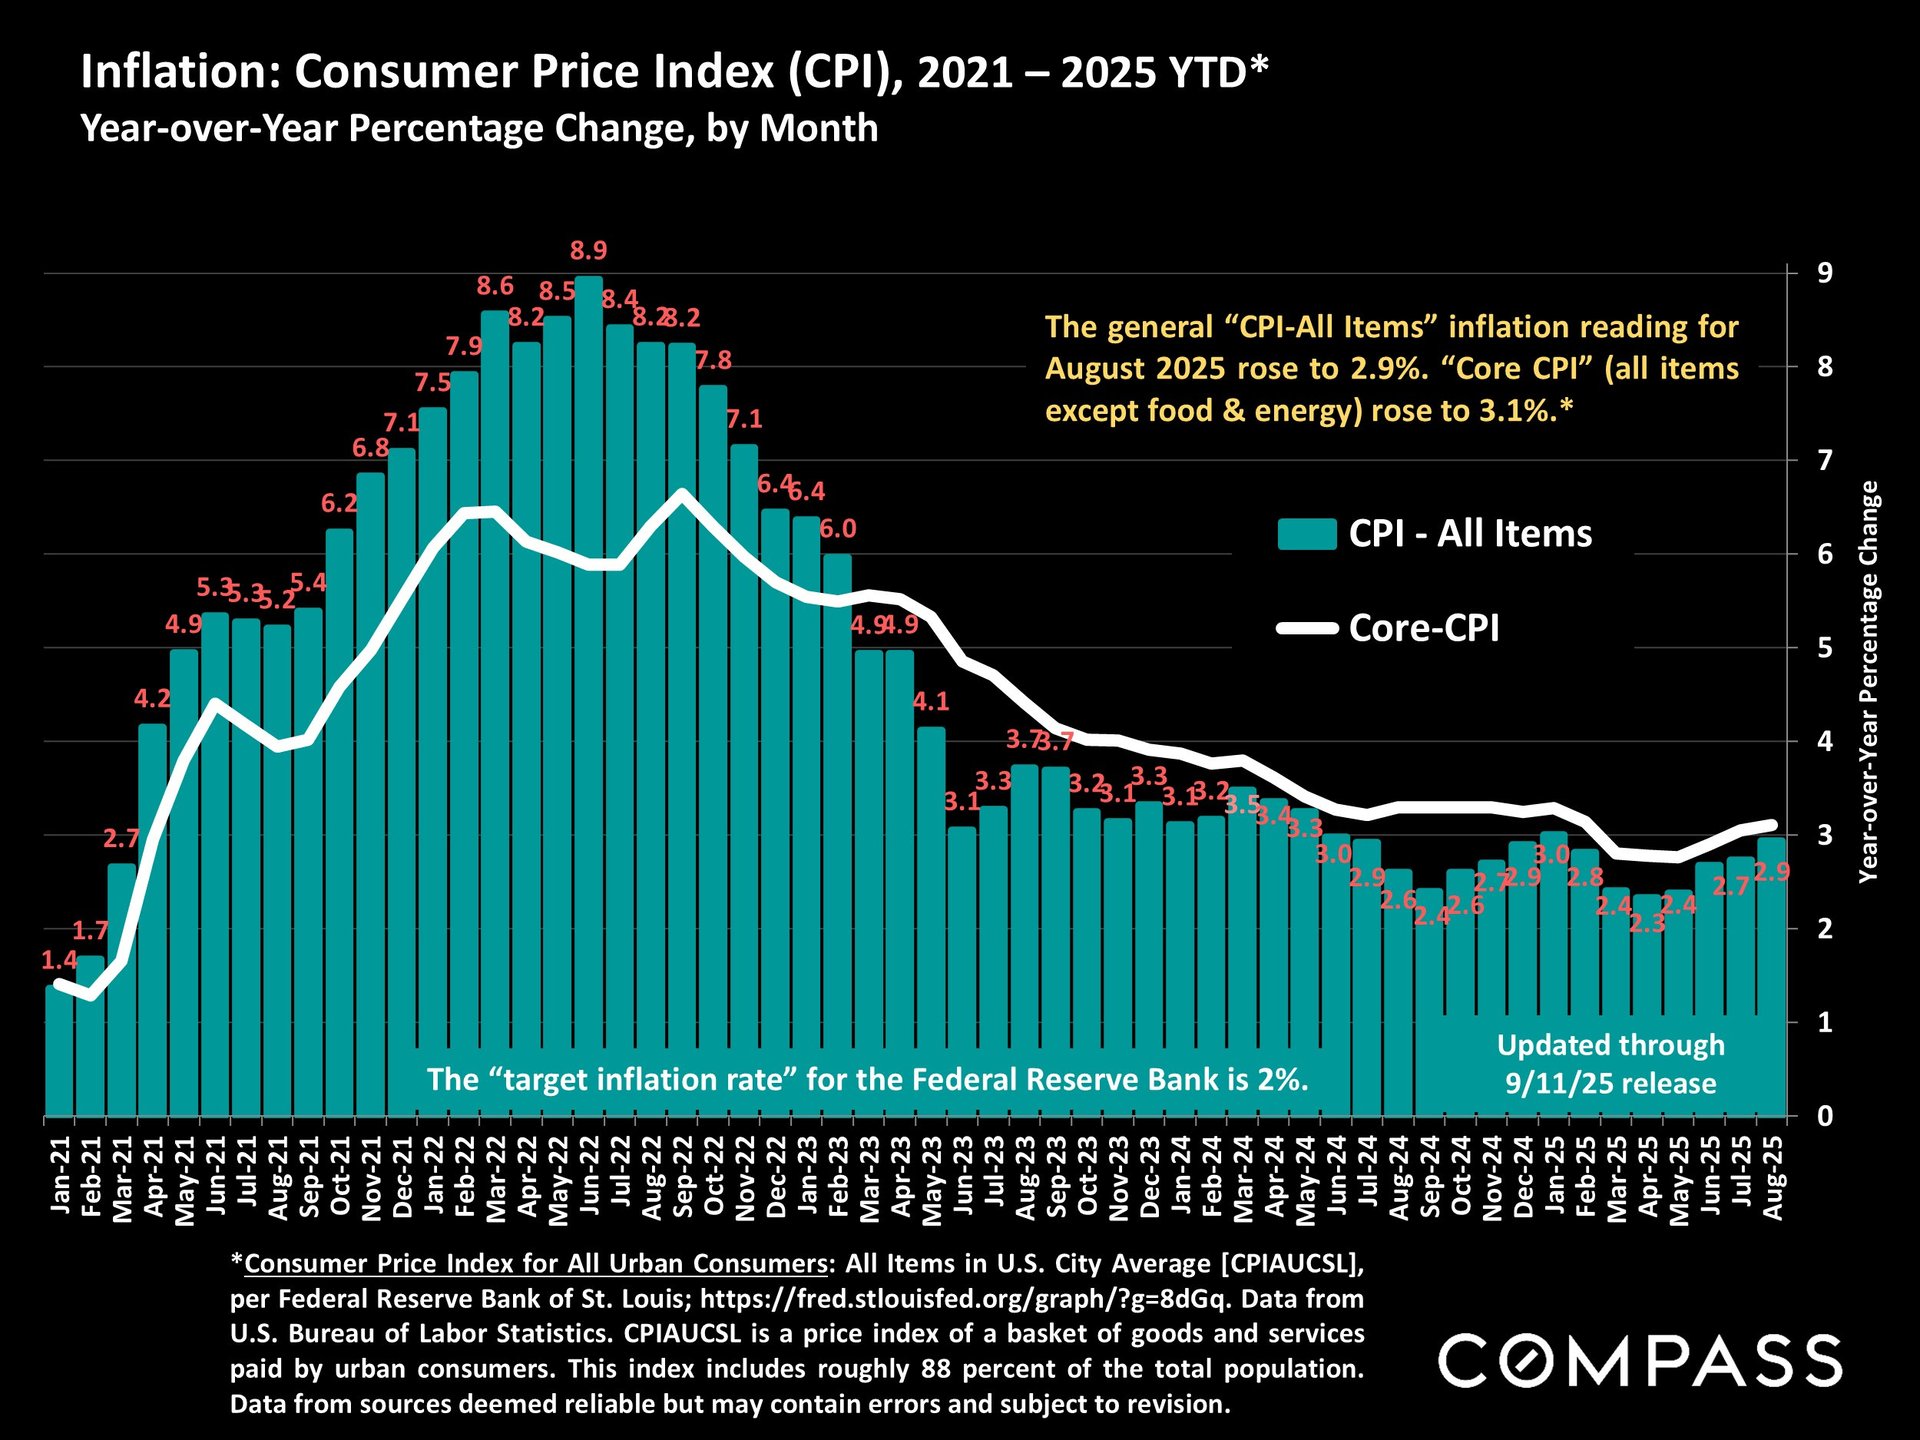
Inflation has been rising modestly since hitting a four-year low in April, and consumer expectations suggest it could increase further.
-
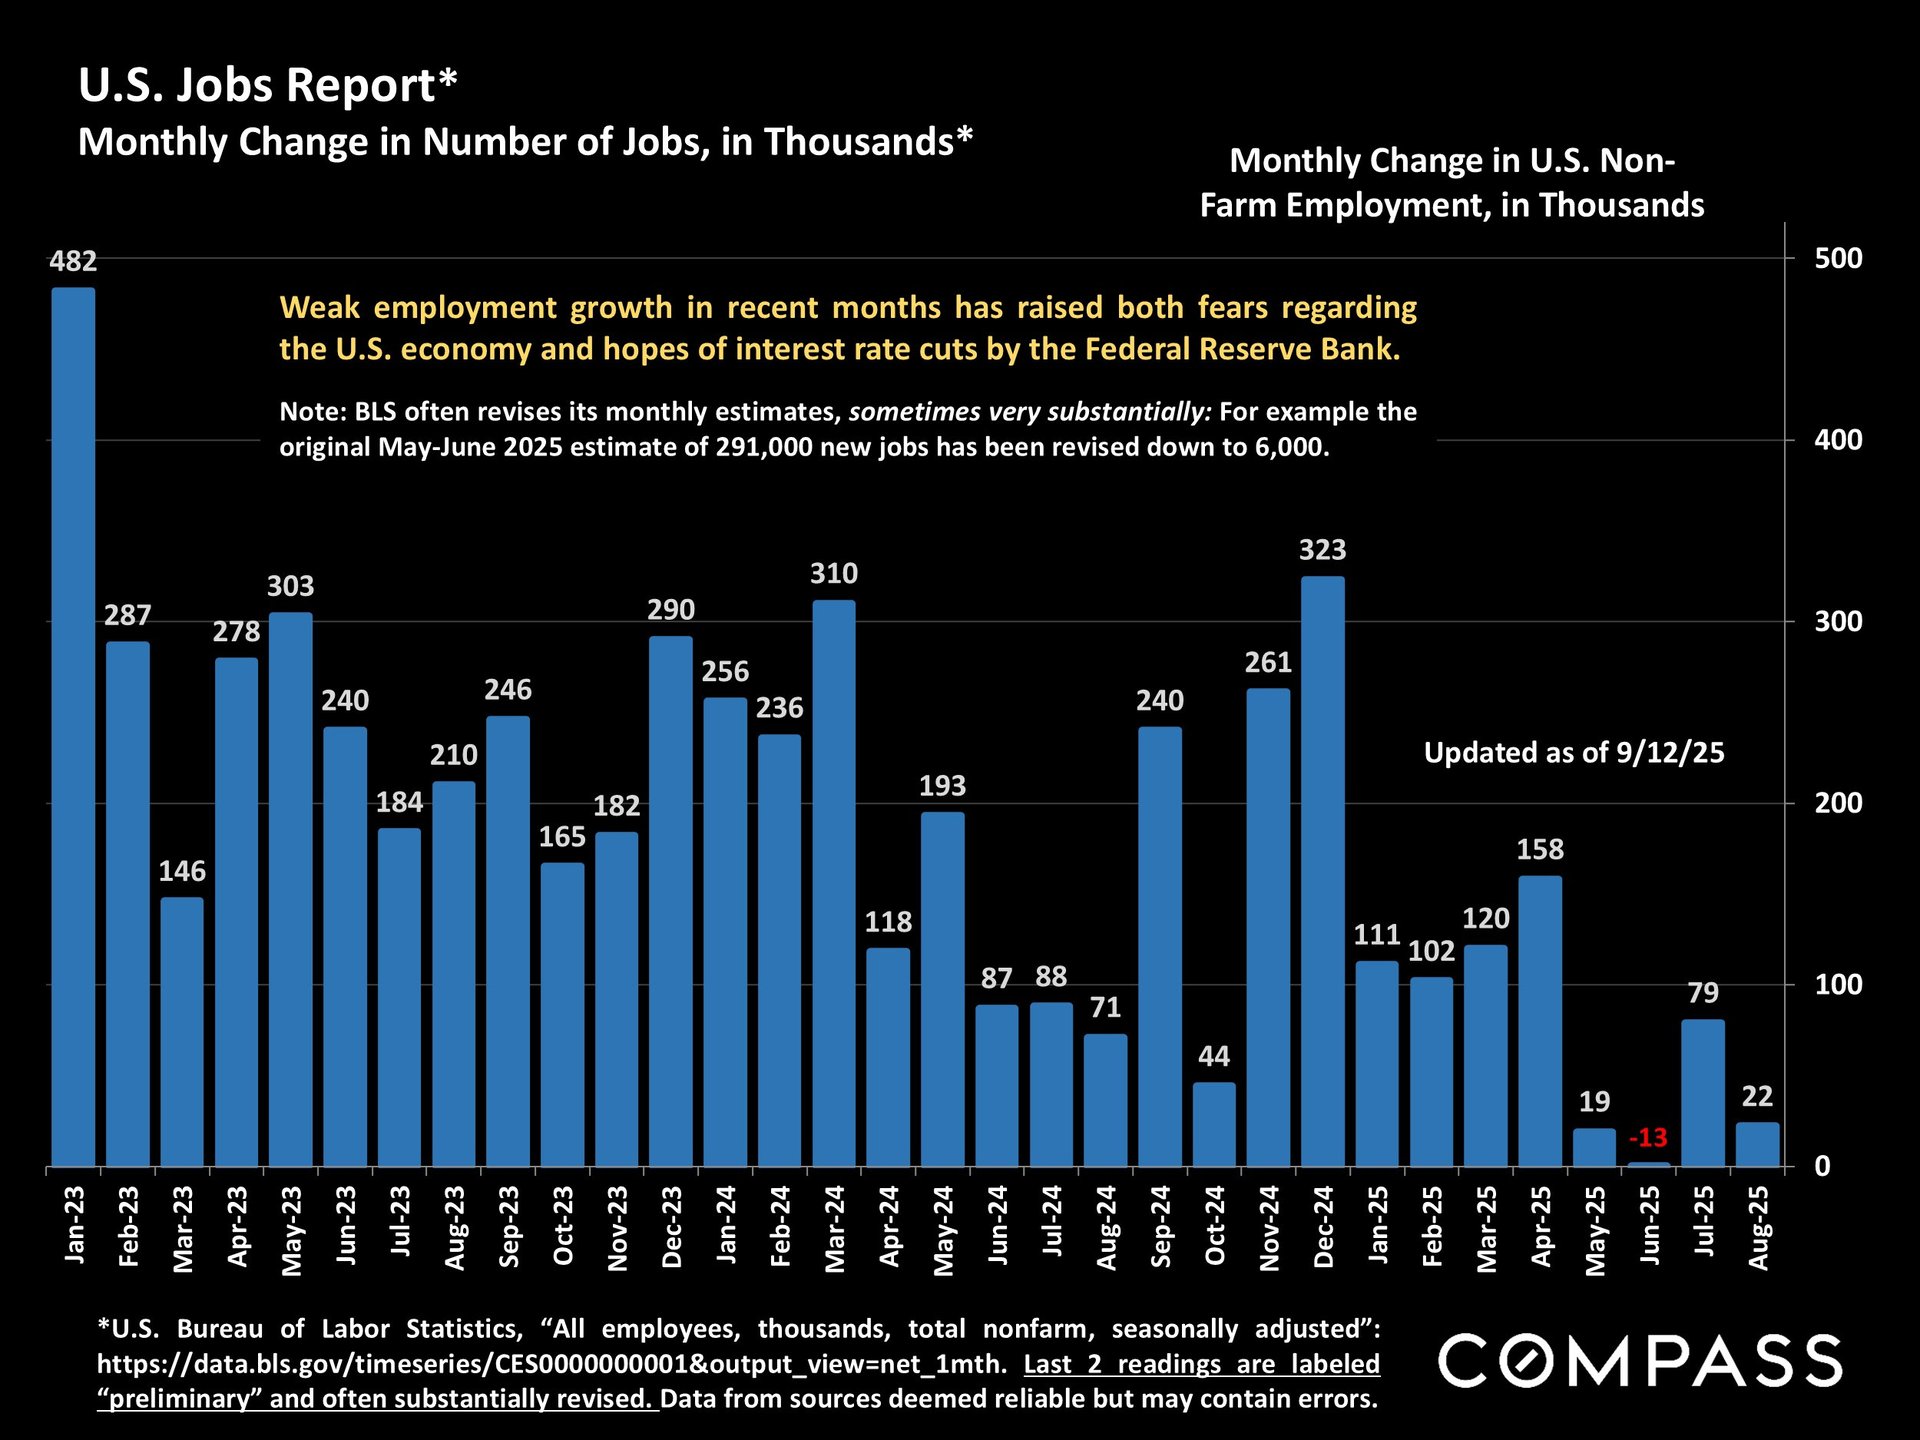
Job growth has slowed, and the unemployment rate has risen to its highest level since 2021, heightening concerns around employment security among lower- and middle-income households.
-
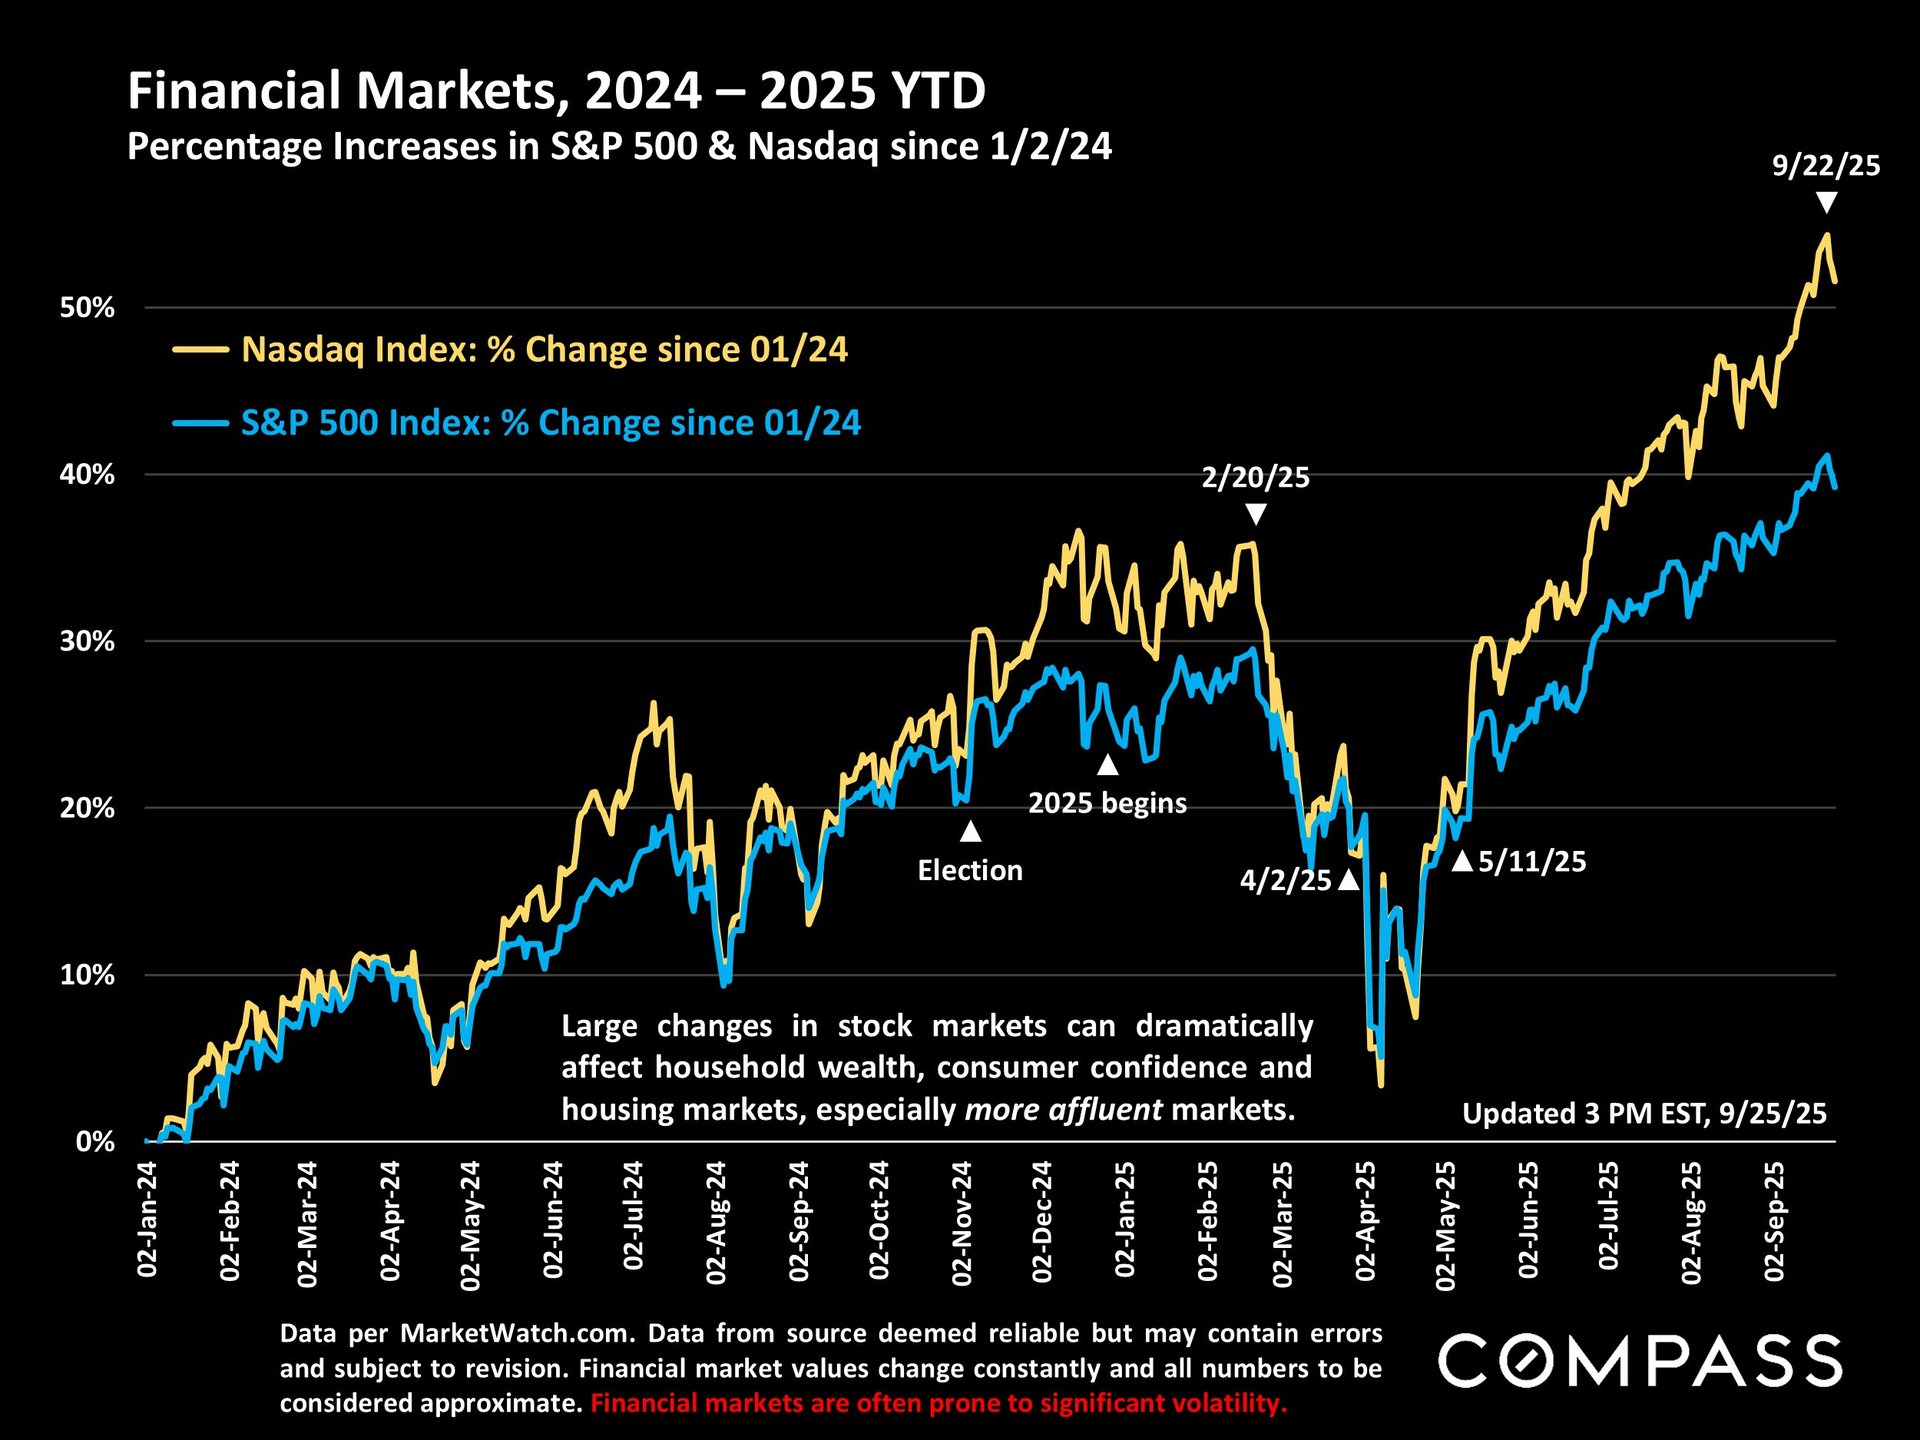
Meanwhile, stock markets have continued to hit new highs, contributing to robust luxury market activity.
Looking Ahead
As we move into the fall selling season, all eyes will be on mortgage rate trends and consumer confidence. While rising inventory and longer days on market may challenge sellers, these same factors create new opportunities for buyers who are patient, strategic, and well-prepared.
In this environment, The Blackshaw Messel Group is here to help both buyers and sellers navigate shifting market conditions with clarity and confidence—leveraging data-driven insights, expert negotiation, and personalized strategies to achieve successful outcomes.

Photo Courtesy of Something Blue Design