
As we move into the final stretch of 2025, the U.S. housing market continues to shift in meaningful—though often subtle—ways. Interest rates, inventory, and consumer behavior are all playing important roles in shaping buyer and seller activity across the country.
Interest Rates & Financial Conditions
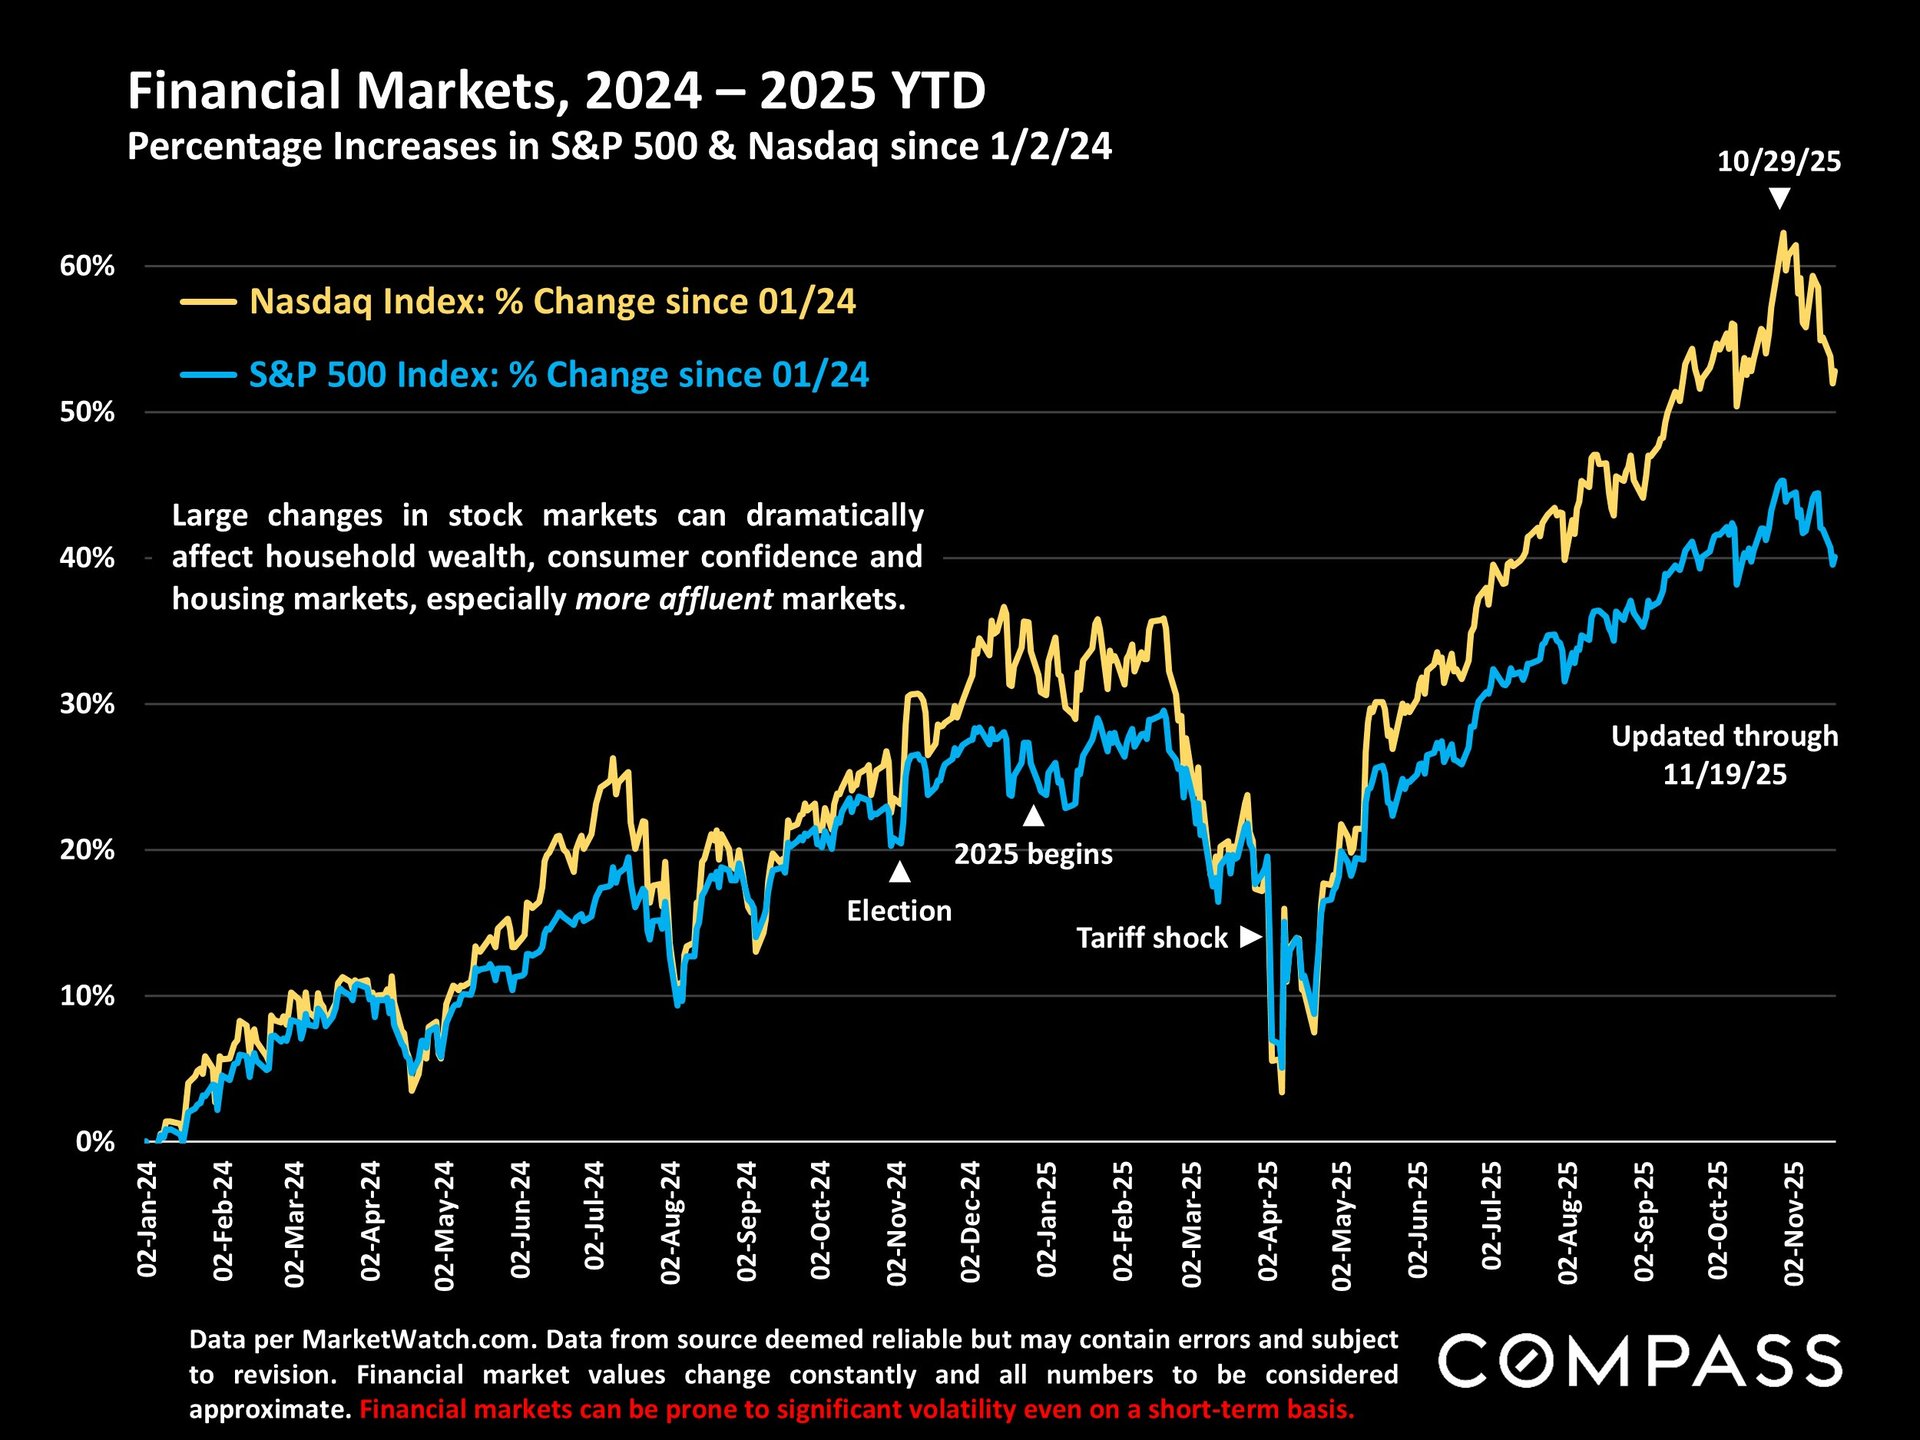
After dipping near three-year lows at the end of October, mortgage rates ticked up slightly in early November. Even with this modest increase, rates remain close to their most favorable levels since 2022, helping boost affordability after several challenging years.
Stock markets, meanwhile, have been volatile since their late-October highs, reflecting broad economic uncertainty as investors attempt to anticipate the Federal Reserve’s next steps. The Fed has implemented only two small rate cuts in 2025 to date, and projections for December—as well as 2026—vary widely. Employment and unemployment trends will be key indicators the Fed continues to monitor.

Photos Courtesy of Compass
New NAR Data: 2025 Profile of Home Buyers & Sellers
The National Association of Realtors released its annual report on November 4, and it offers a revealing snapshot of today’s buyer and seller demographics and behaviors.
Some notable stats from the report include:
-
The median age of all homebuyers is now 59, an all-time high. First-time buyers have a median age of 42, and repeat buyers 60 (Page 2–3) .
-
61% of buyers are married couples, while 24% have at least one child under 18 at home (Page 2) .
-
76% purchased a detached single-family home, with a typical size of 1,900 sq. ft. (Page 6) .
-
88% of buyers worked with a real estate agent (Page 8) .
-
The typical home seller was 64 years old and had lived in their home for 11 years (Page 10) .
These demographics highlight not only an aging buyer pool but also shifting lifestyle priorities, multigenerational considerations, and continued reliance on professional representation.
National & Metro-Area Home Prices
The next set of data looks at national median home prices and how they’ve evolved.
National Median House Prices Since 1990
National home prices remain elevated, though their rate of growth has varied dramatically by region over the past several years.
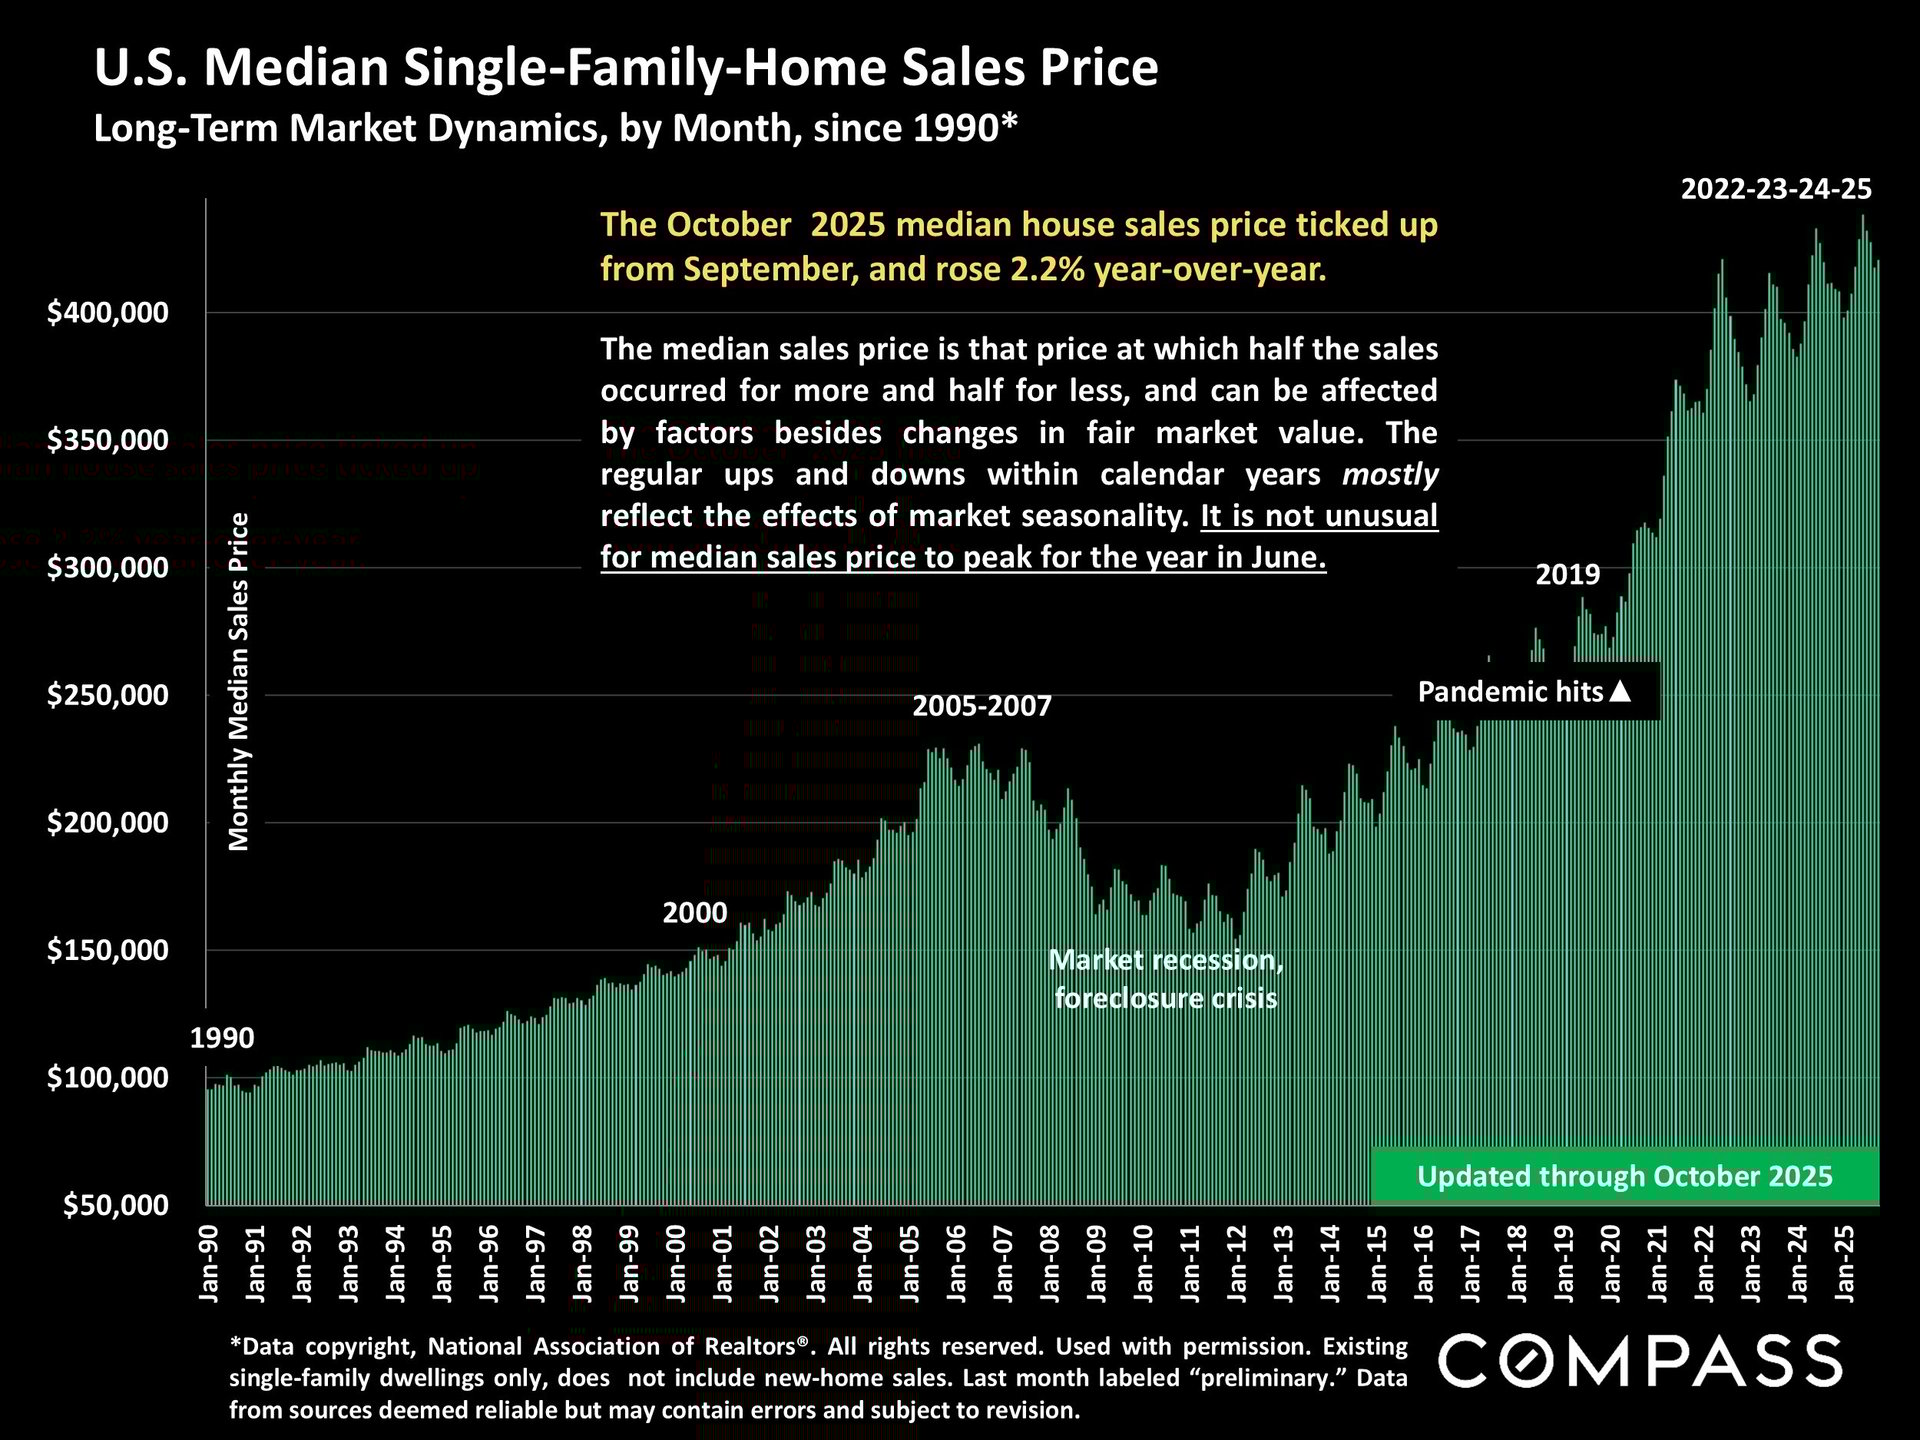
Photo Courtesy of Compass
Q3 2025 ‘Metro-Area’ Median House Prices
A comparison of Q3 metro-area results shows:
-
Northeast metros have generally posted the strongest year-over-year appreciation.
-
Southern and Southeastern metros are more likely to have seen year-over-year declines after experiencing some of the country’s steepest appreciation from 2020–2023.
-
Metro areas represent multi-county regions, often containing submarkets with very different price dynamics—meaning local variation can be significant (Page 15–16).
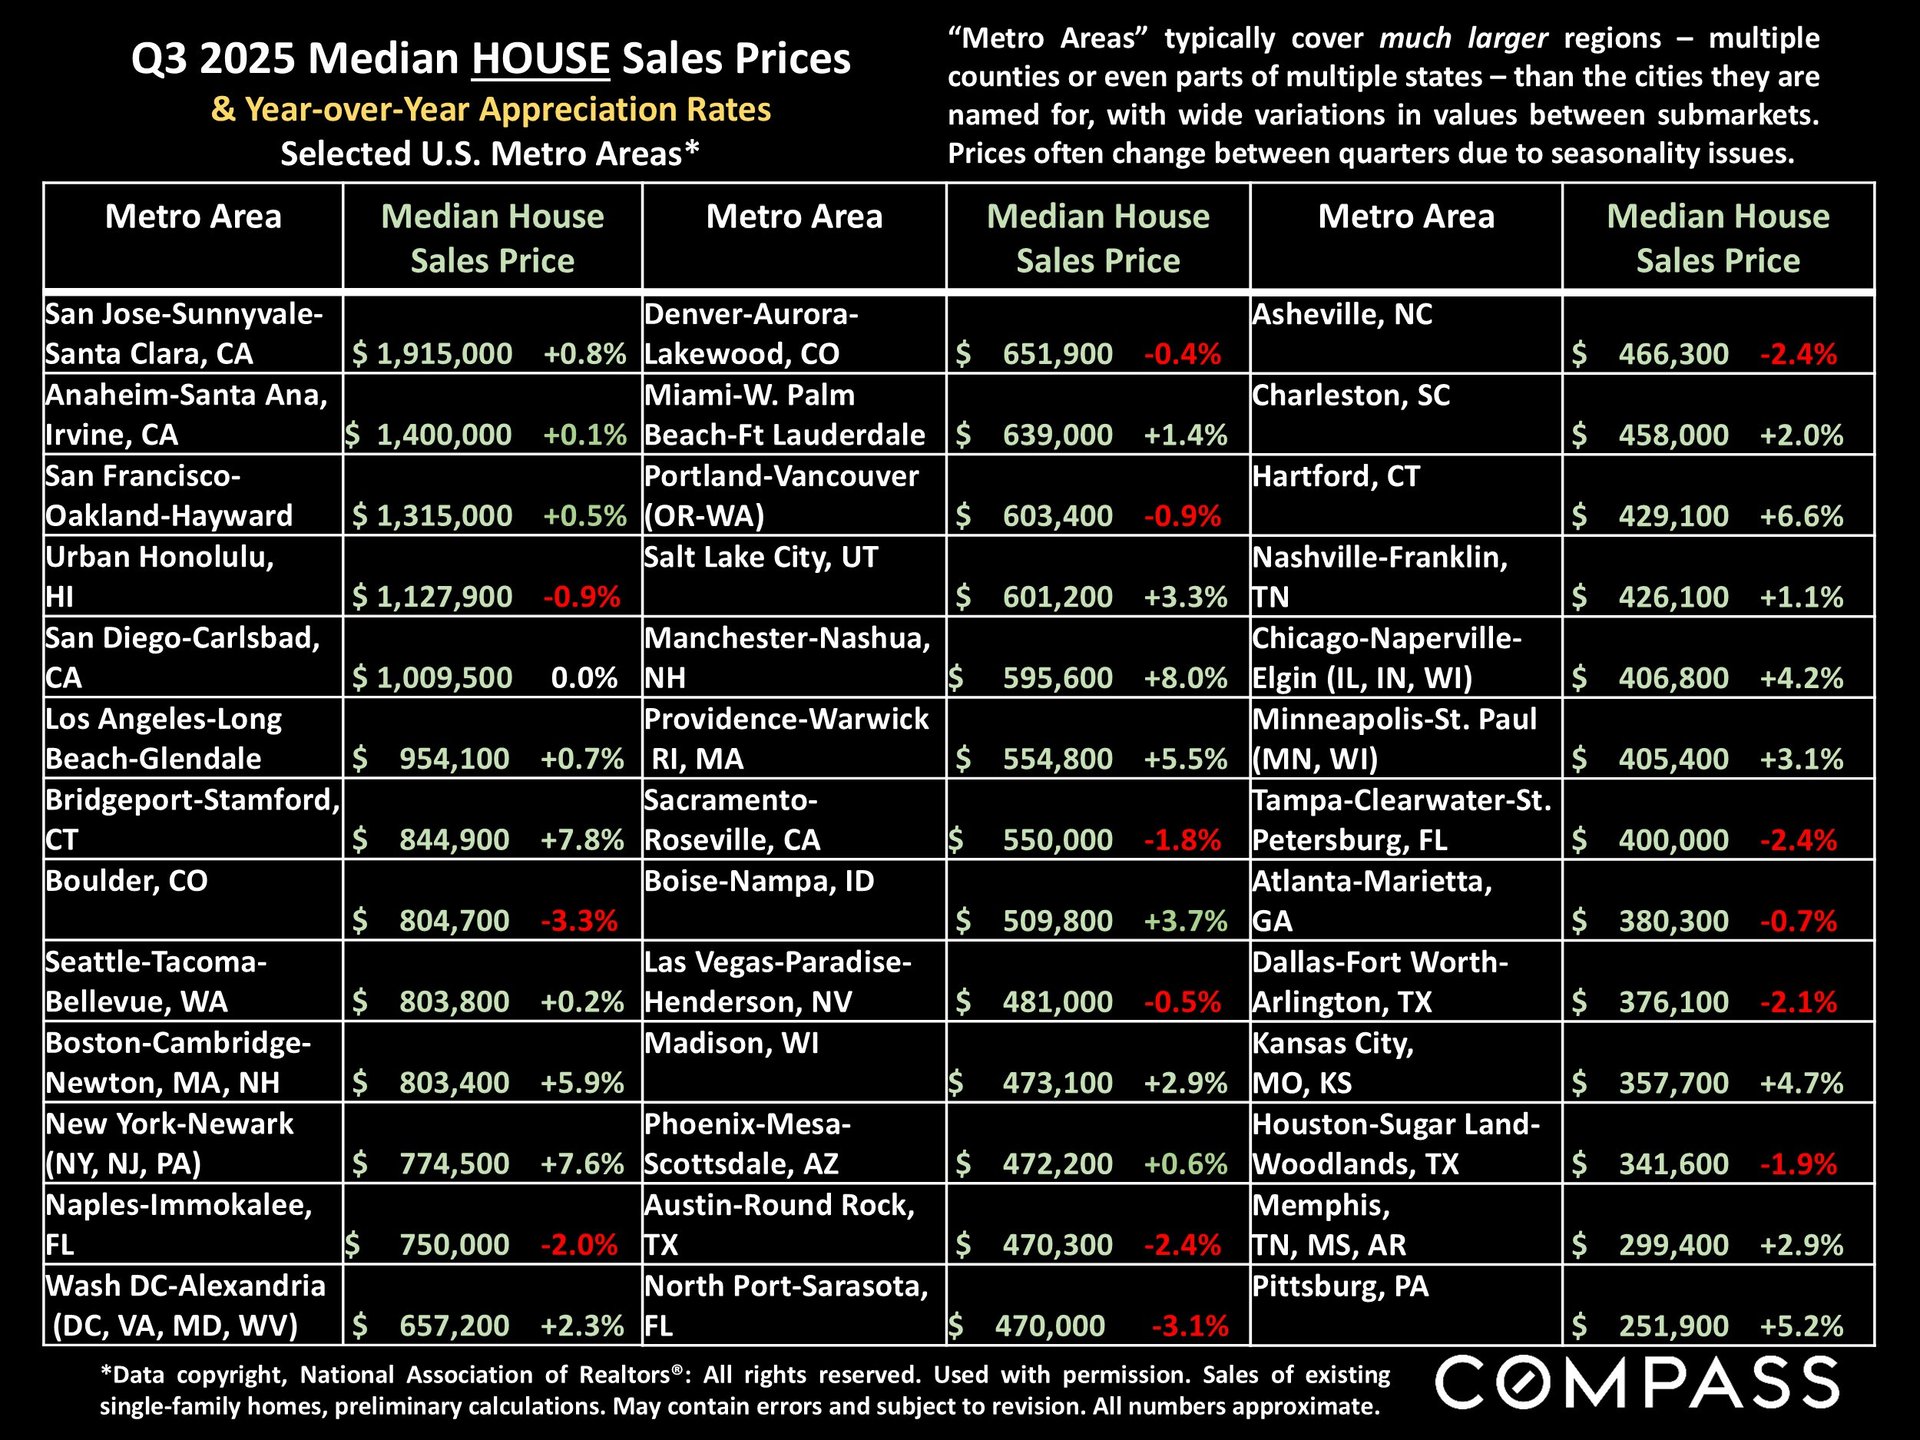
Photo Courtesy of Compass
Condo & Co-Op Prices
Condos and co-ops have been more likely to show price declines year-over-year compared to single-family homes.
However, many Northeast metros bucked this trend, with positive growth in several major markets (Page 16) .

Photo Courtesy of Compass
Regional Home Prices (Combined Houses + Condos)
NAR divides the U.S. into four broad regions: Midwest, South, Northeast, and West.
A chart of median sale prices since 2020 shows:
-
Each region reached its peak price at different times (red bars), with most peaking in 2022 or early 2023.
-
Prices in October 2025 (green bars) remain below peak levels in many areas but have shown resilience as interest rates eased.
-
Seasonal patterns remain strong: prices typically rise in spring and early summer before cooling later in the year (Page 14) .
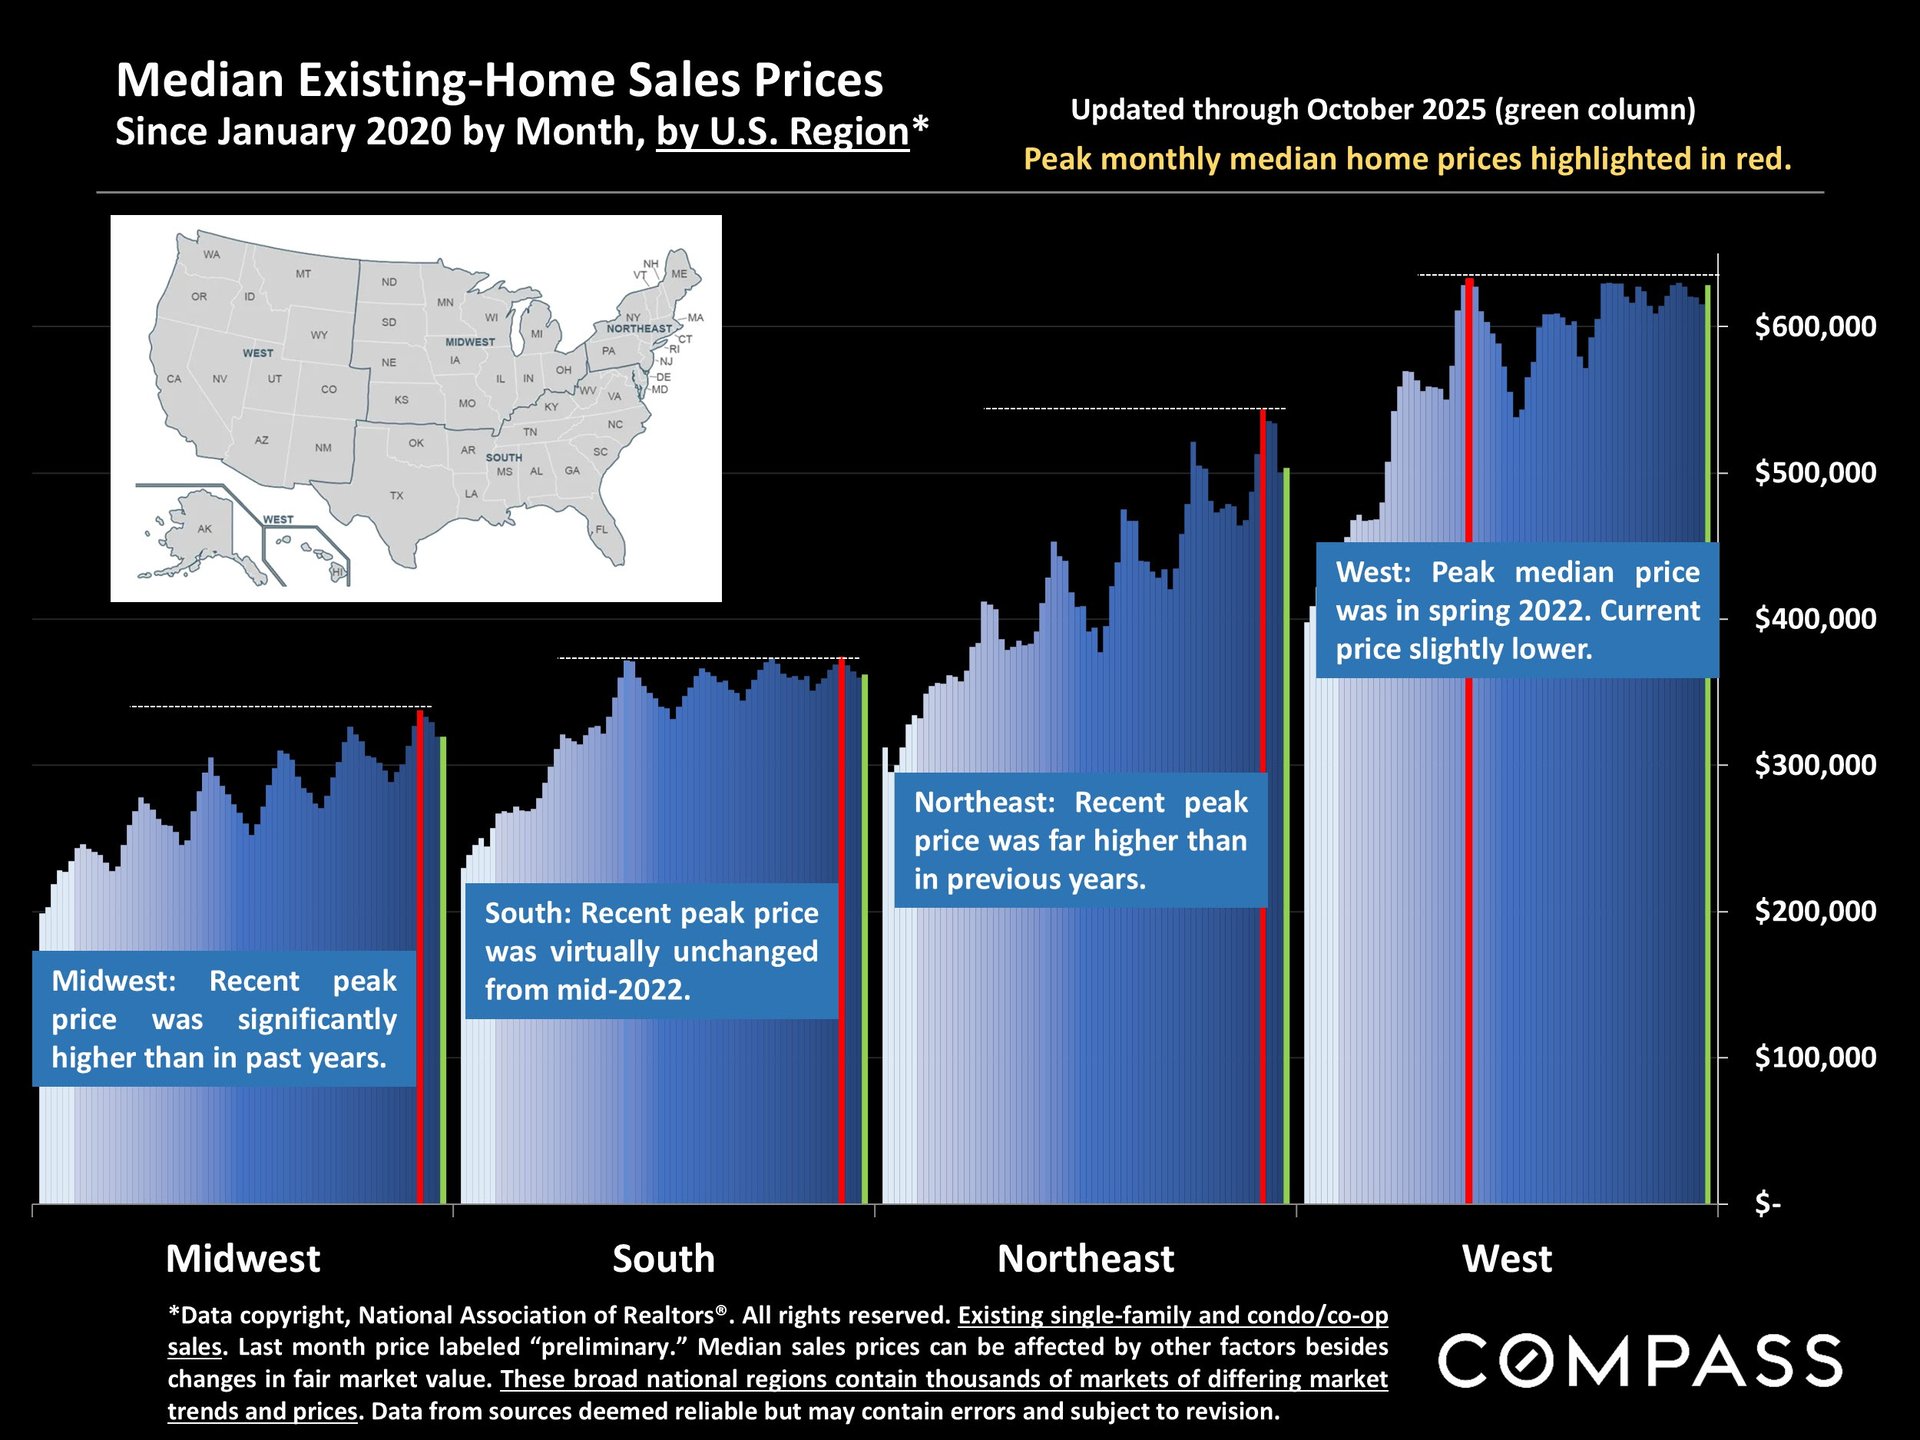
Photo Courtesy of Compass
Inventory, New Listings & Buyer Activity
New Listings
New listings have been gradually decreasing from their spring peak, which is typical for this time of year. However, they remain 5% higher year-over-year, suggesting more sellers are re-entering the market.
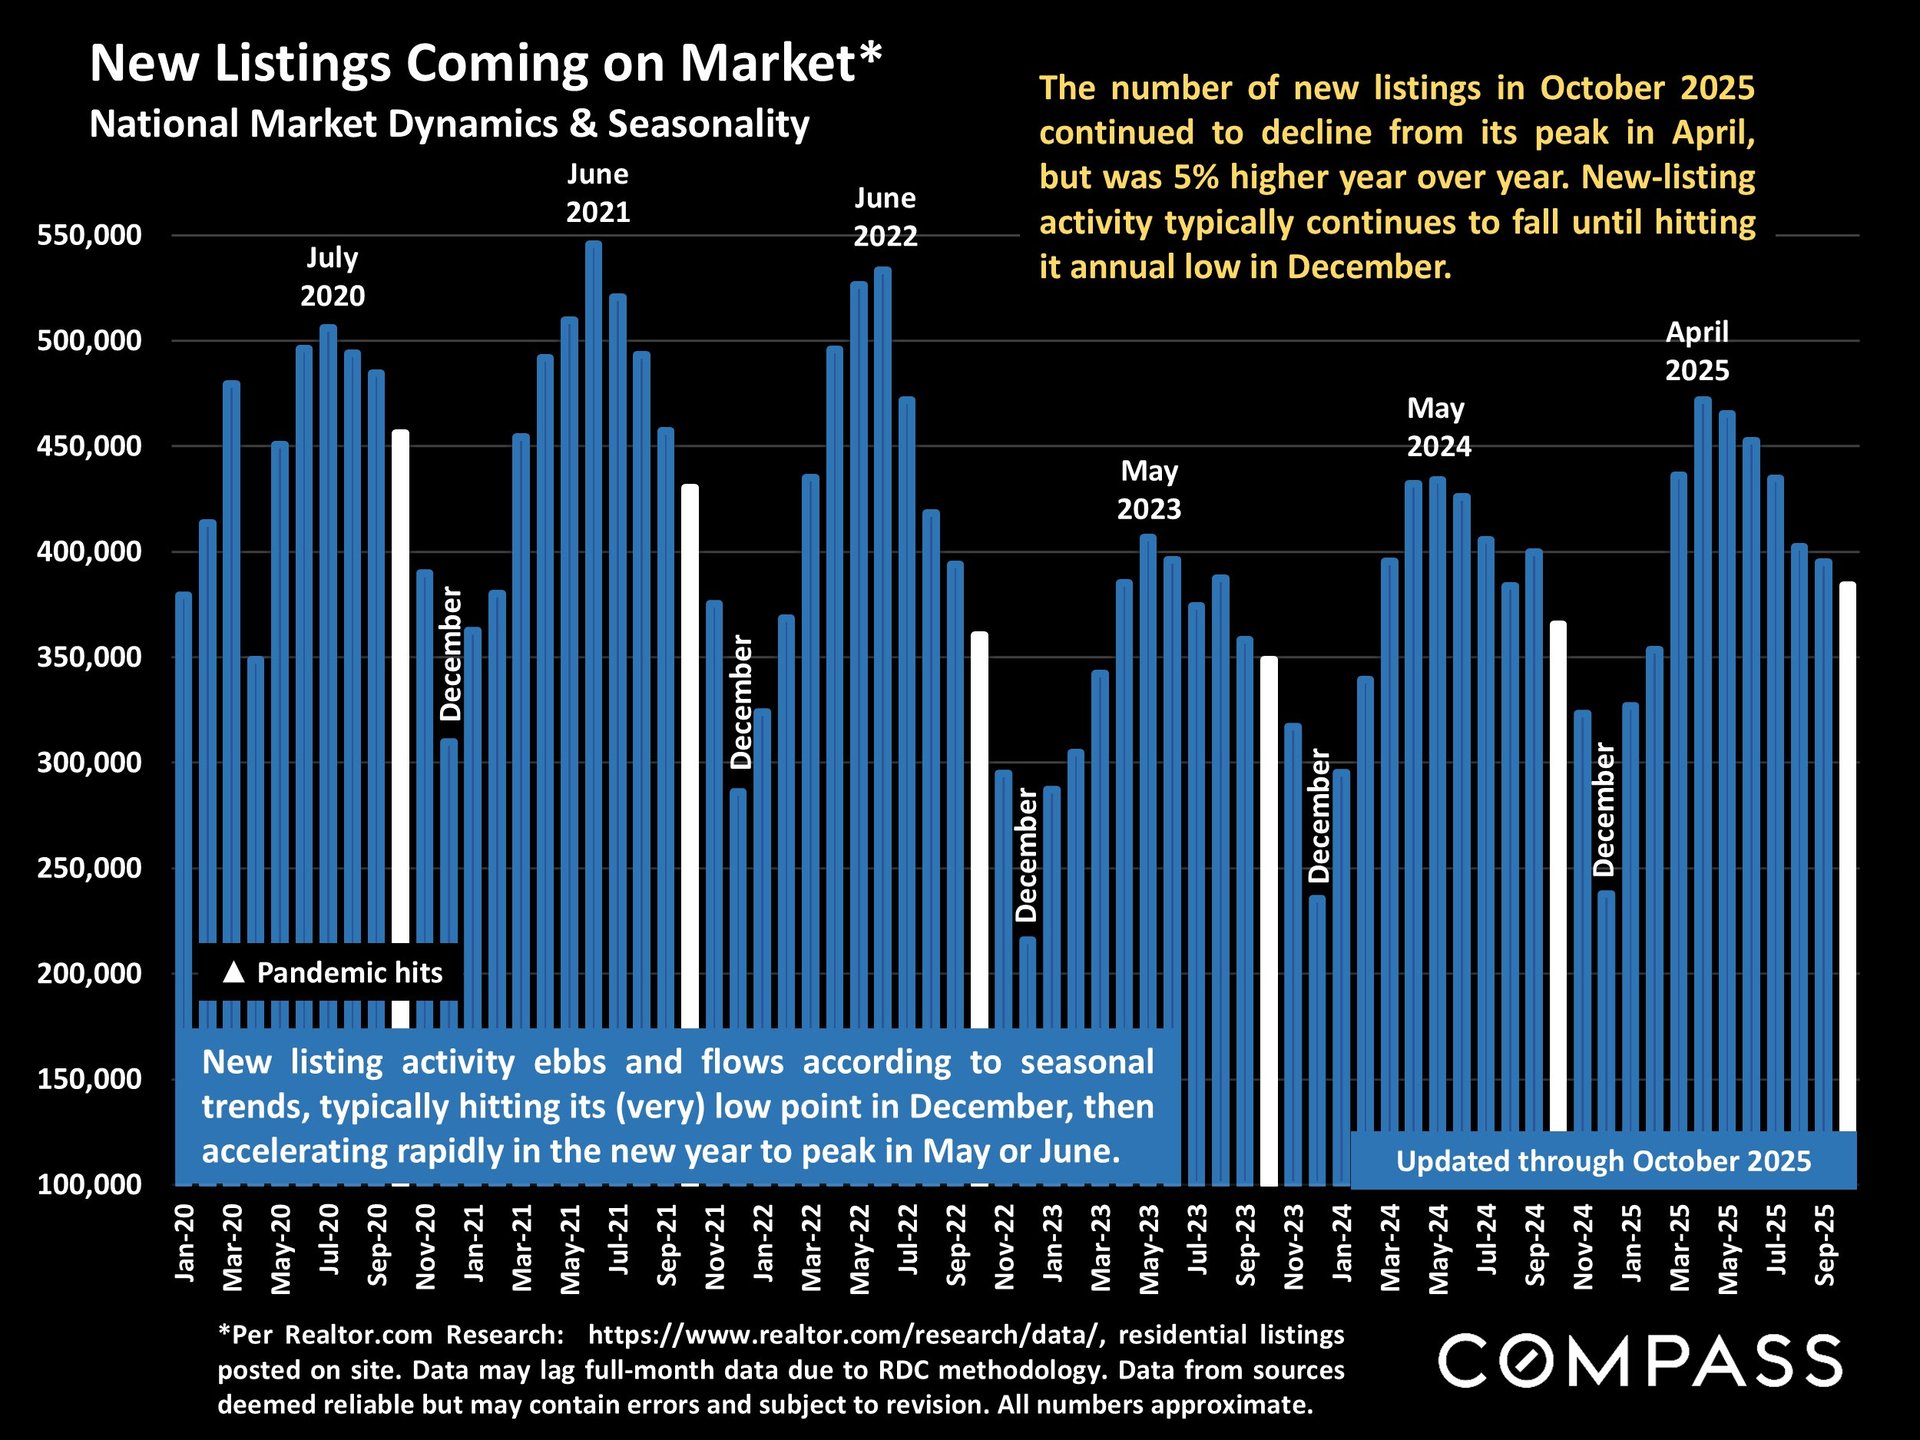
Photo Courtesy of Compass
Active Listings
Year-over-year increases in active inventory have been slowing sharply, but October 2025 still posted an 11% increase compared to October 2024. National inventory is now at its highest point since 2020, though still below long-term norms.
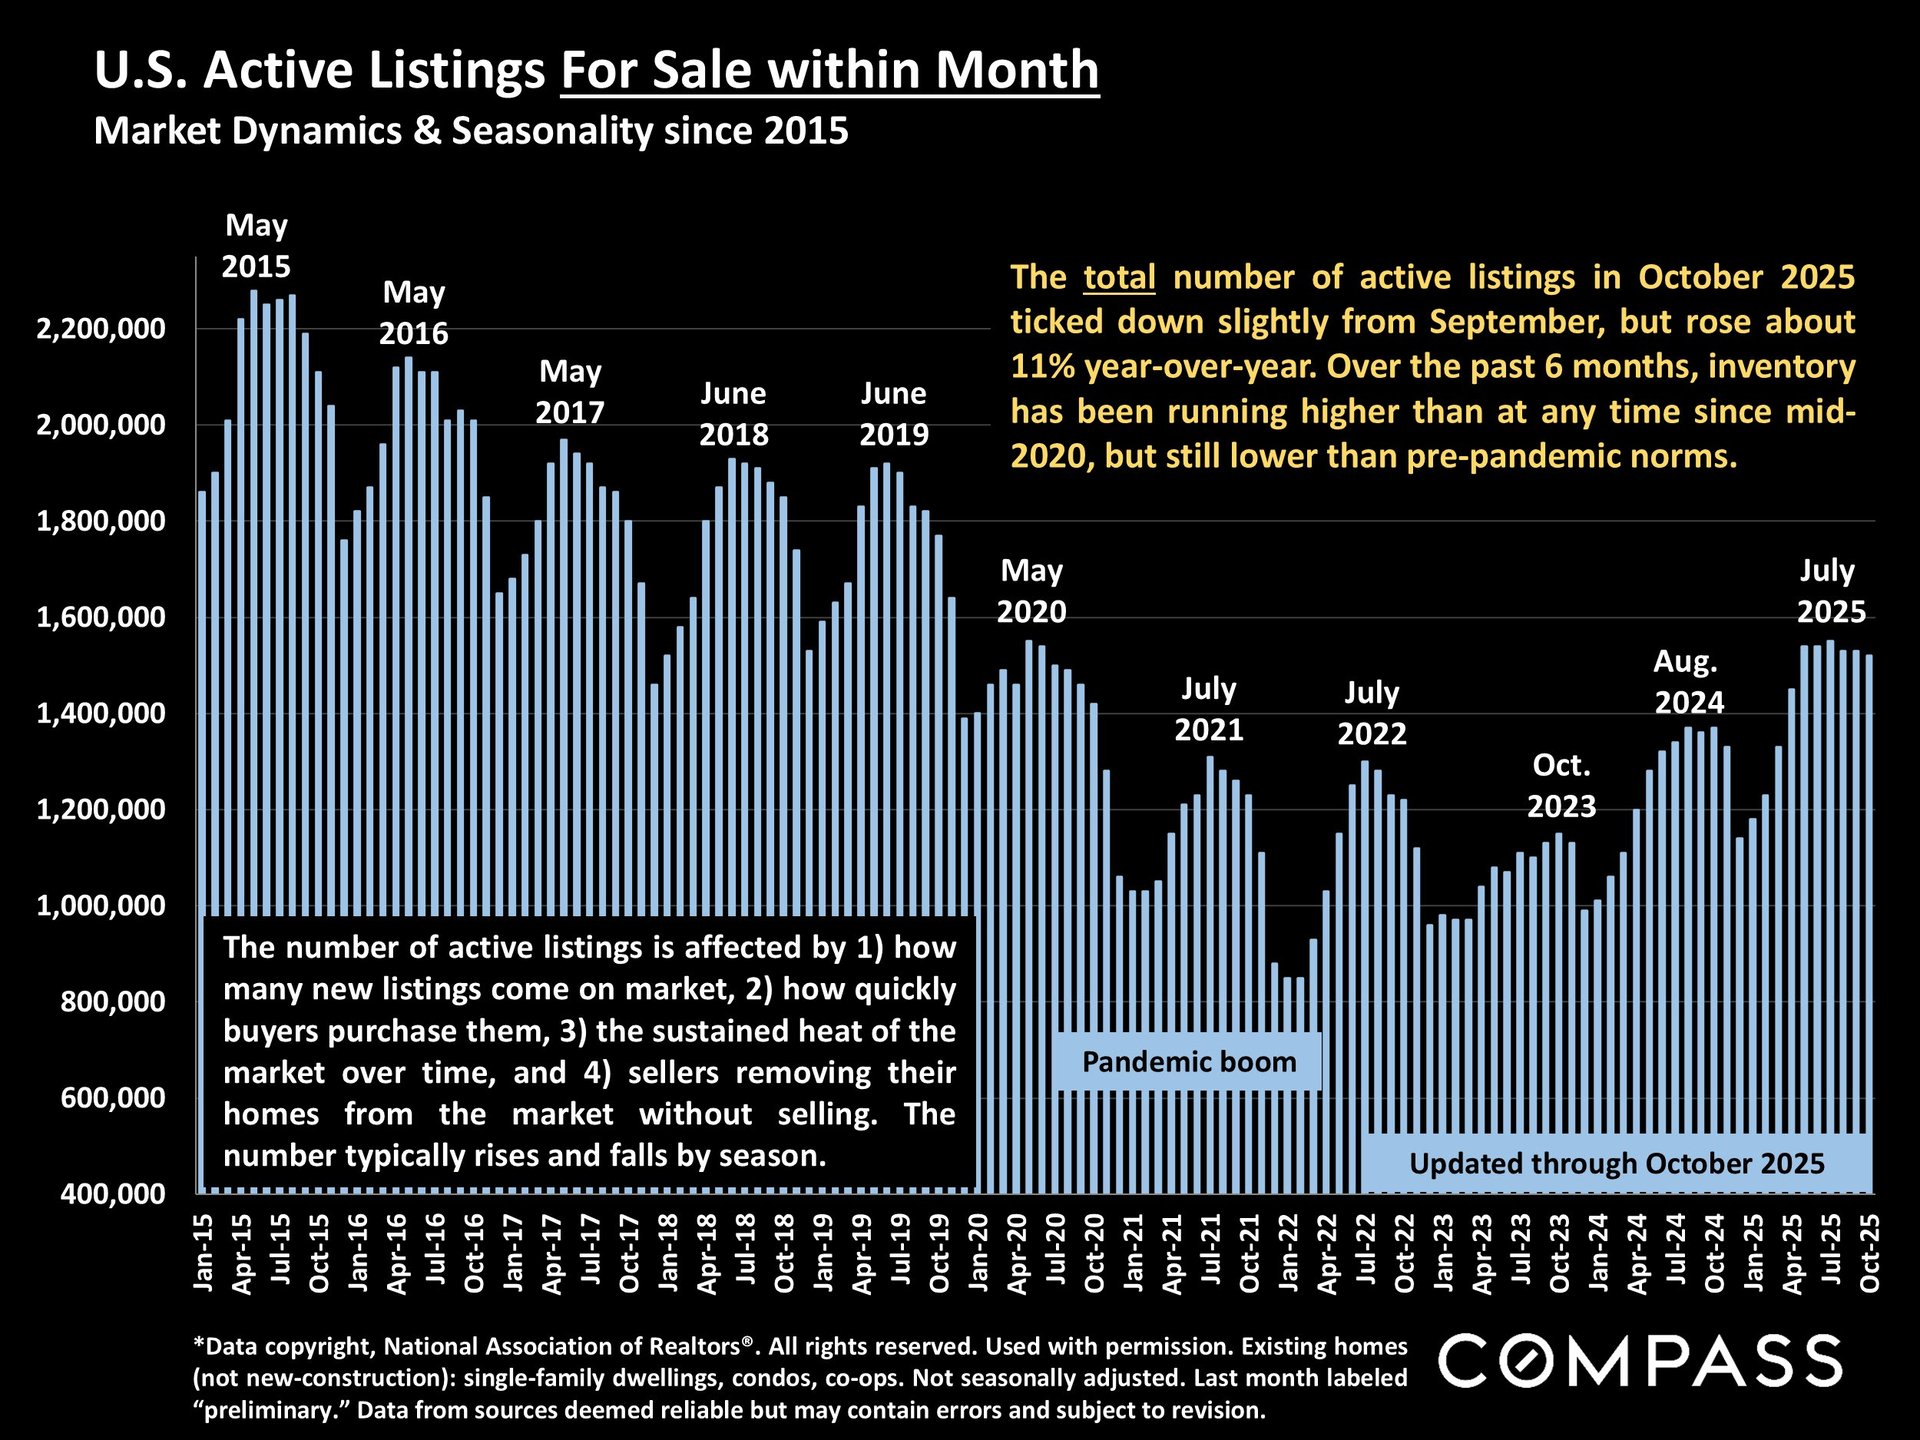
Photo Courtesy of Compass
Pending Sales
Pending sales (listings under contract) typically peak in spring and hit a low in mid-winter. October reflected a slight year-over-year increase, an encouraging sign for late-season demand.

Photo Courtesy of Compass
Closed Sales
Sales rose modestly in October—up nearly 3% over the same month last year—yet remain historically low when compared to pre-2020 markets.
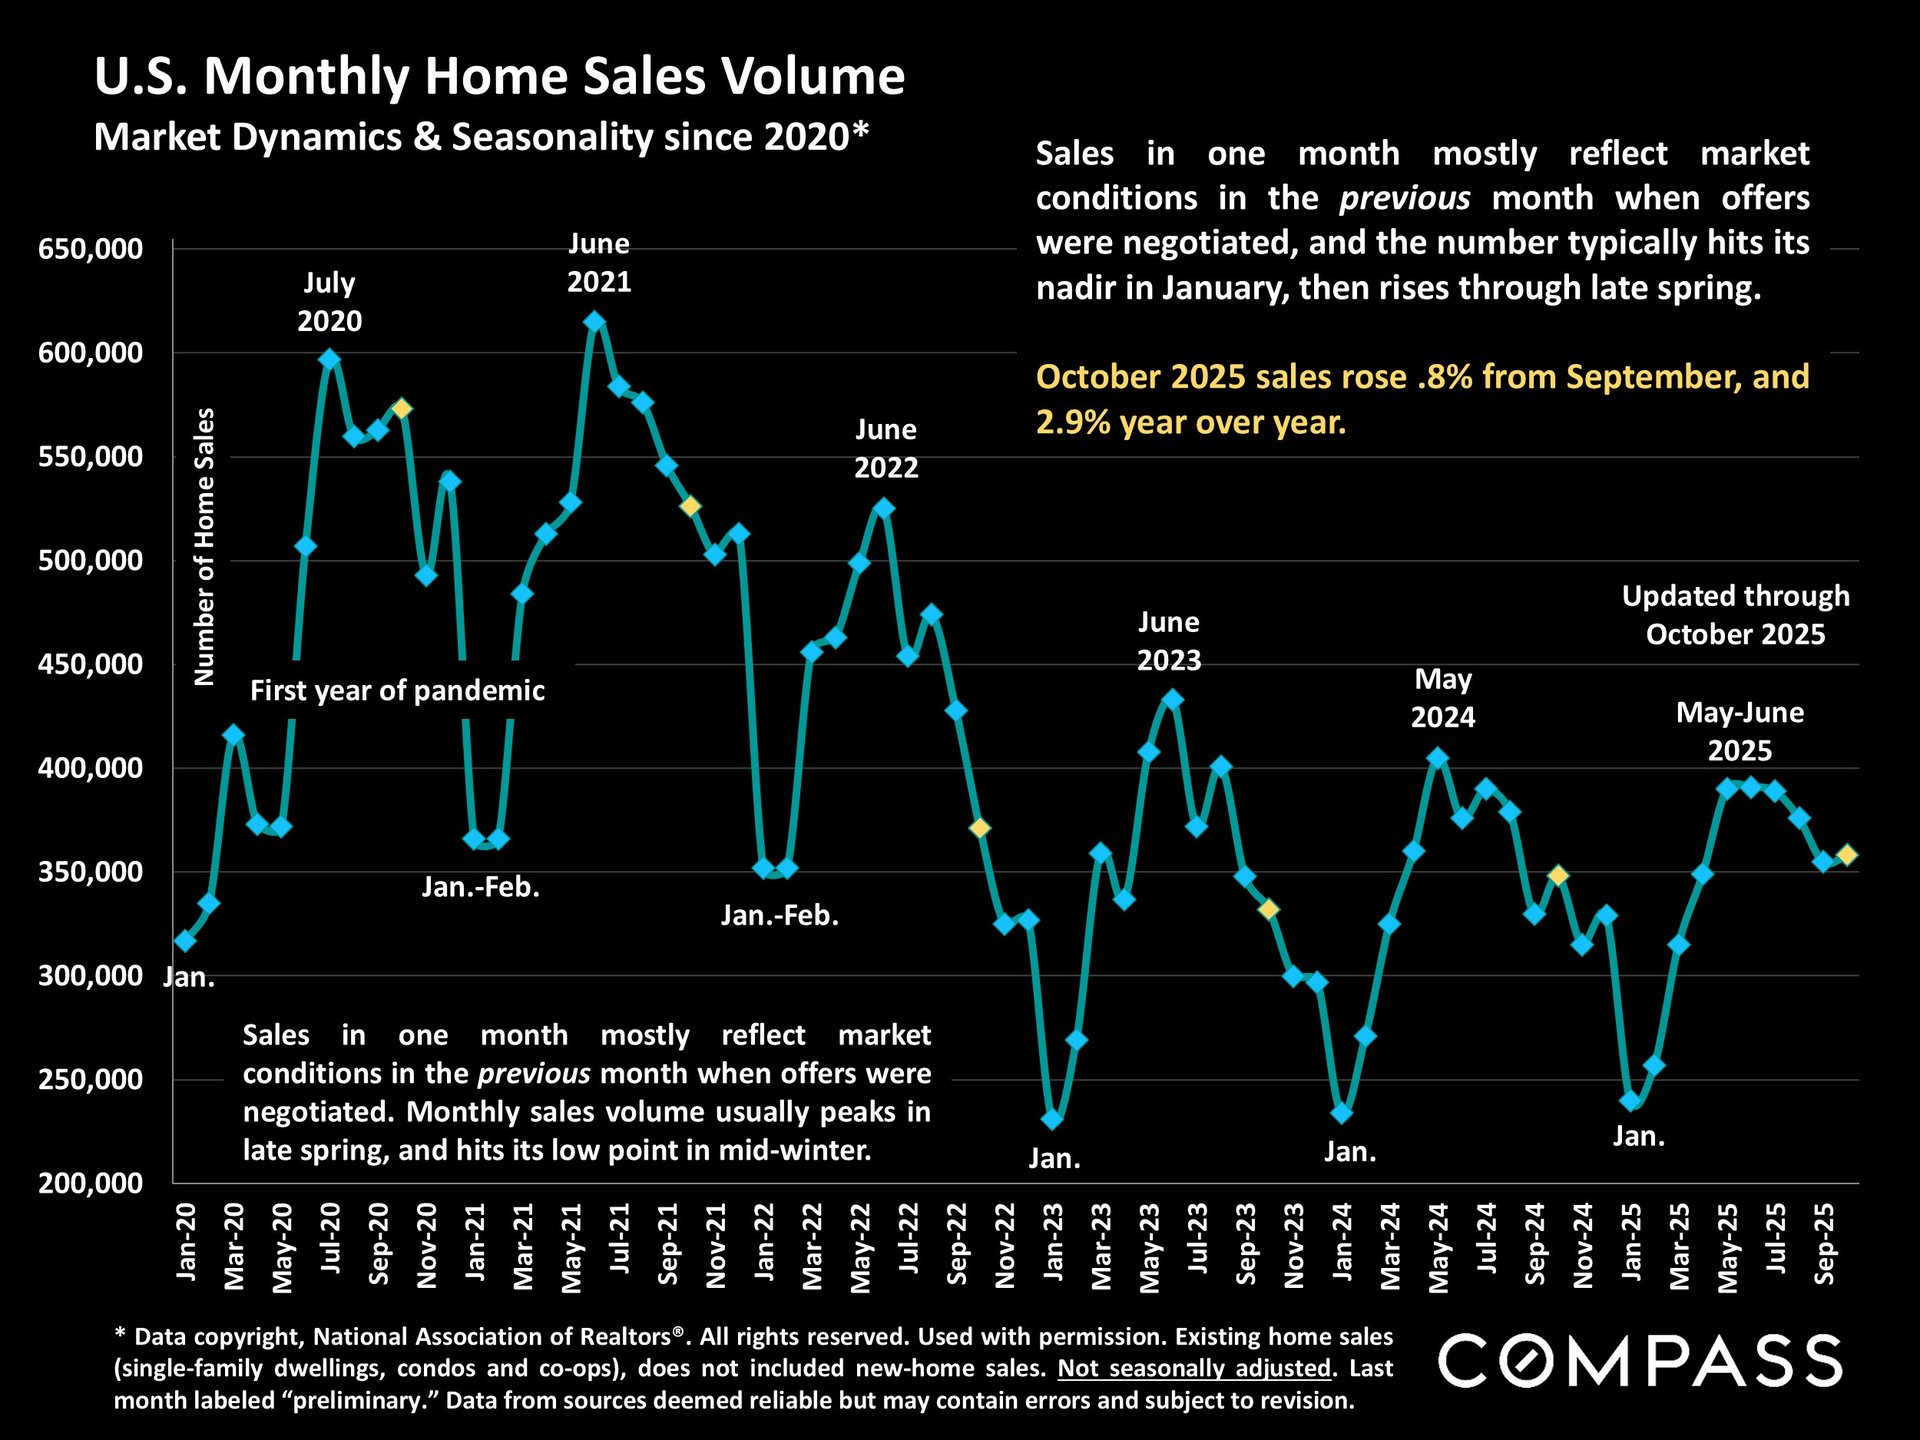
Photo Courtesy of Compass
Pricing Trends & Adjustments
The number of price reductions in October increased 20% year-over-year. However, because total inventory is much higher, the percentage of listings reducing price barely changed. With more homes on the market, a similar percentage translates into a much larger number of reductions overall.

Photo Courtesy of Compass
Months Supply of Inventory (MSI)
MSI has been falling since June, signaling stronger buyer demand through late summer and fall. Even so, MSI is higher than last year due to increased inventory, giving buyers somewhat more negotiating power compared to 2023–2024.
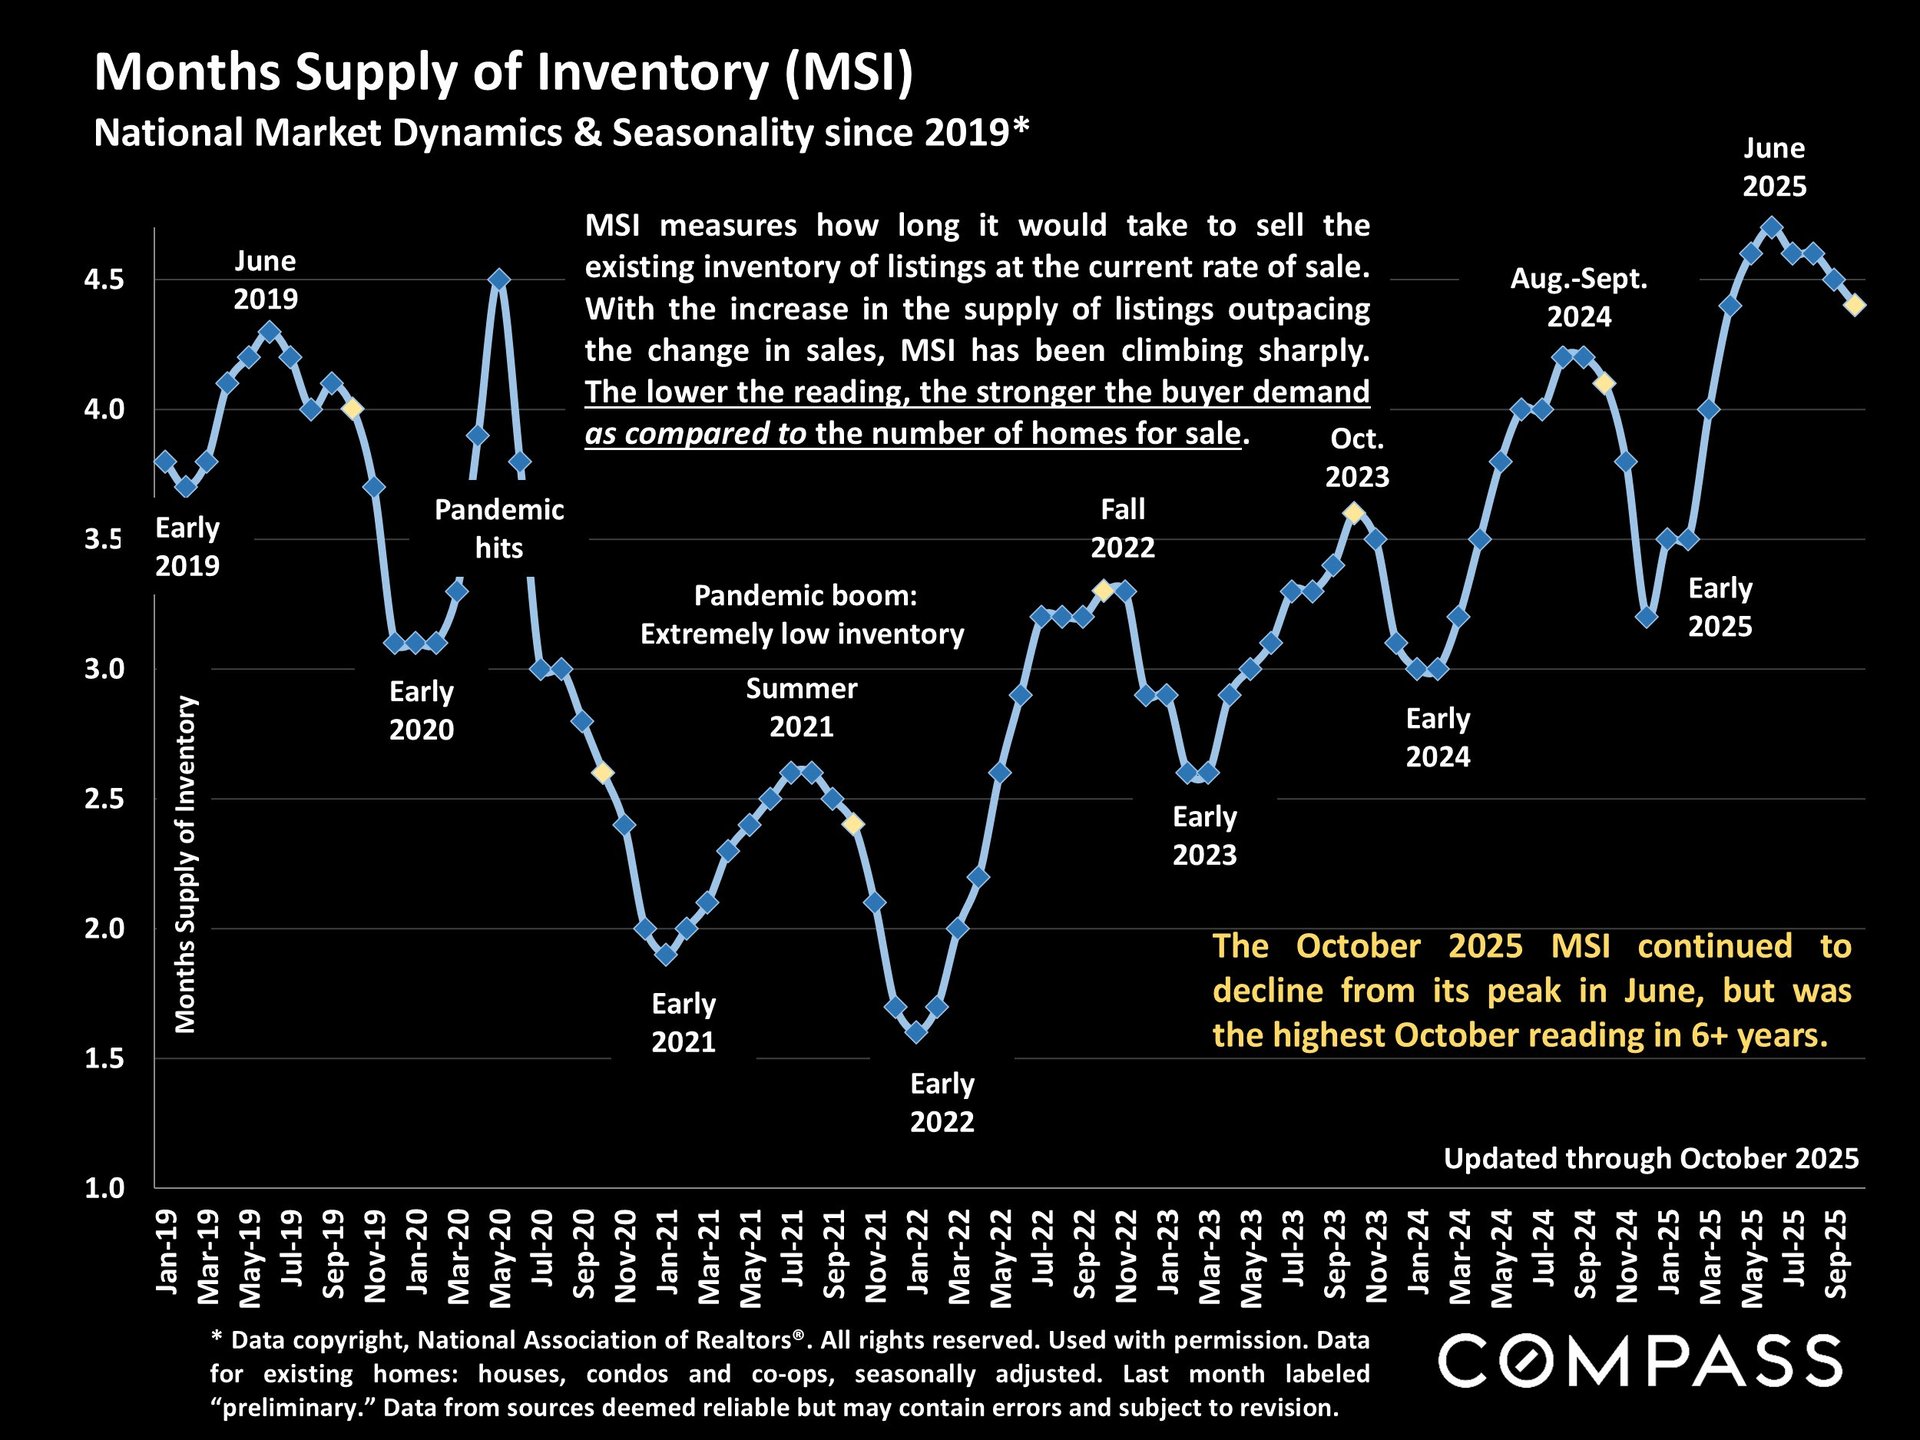
Photo Courtesy of Compass
Affordability, Employment & the Fed
Affordability
Housing affordability—while still a major national challenge—has improved since mortgage rates declined from their 2023–2024 highs.
NAR’s affordability index shows a long-term pattern of severe stress, but recent months have provided modest relief (Page 4).
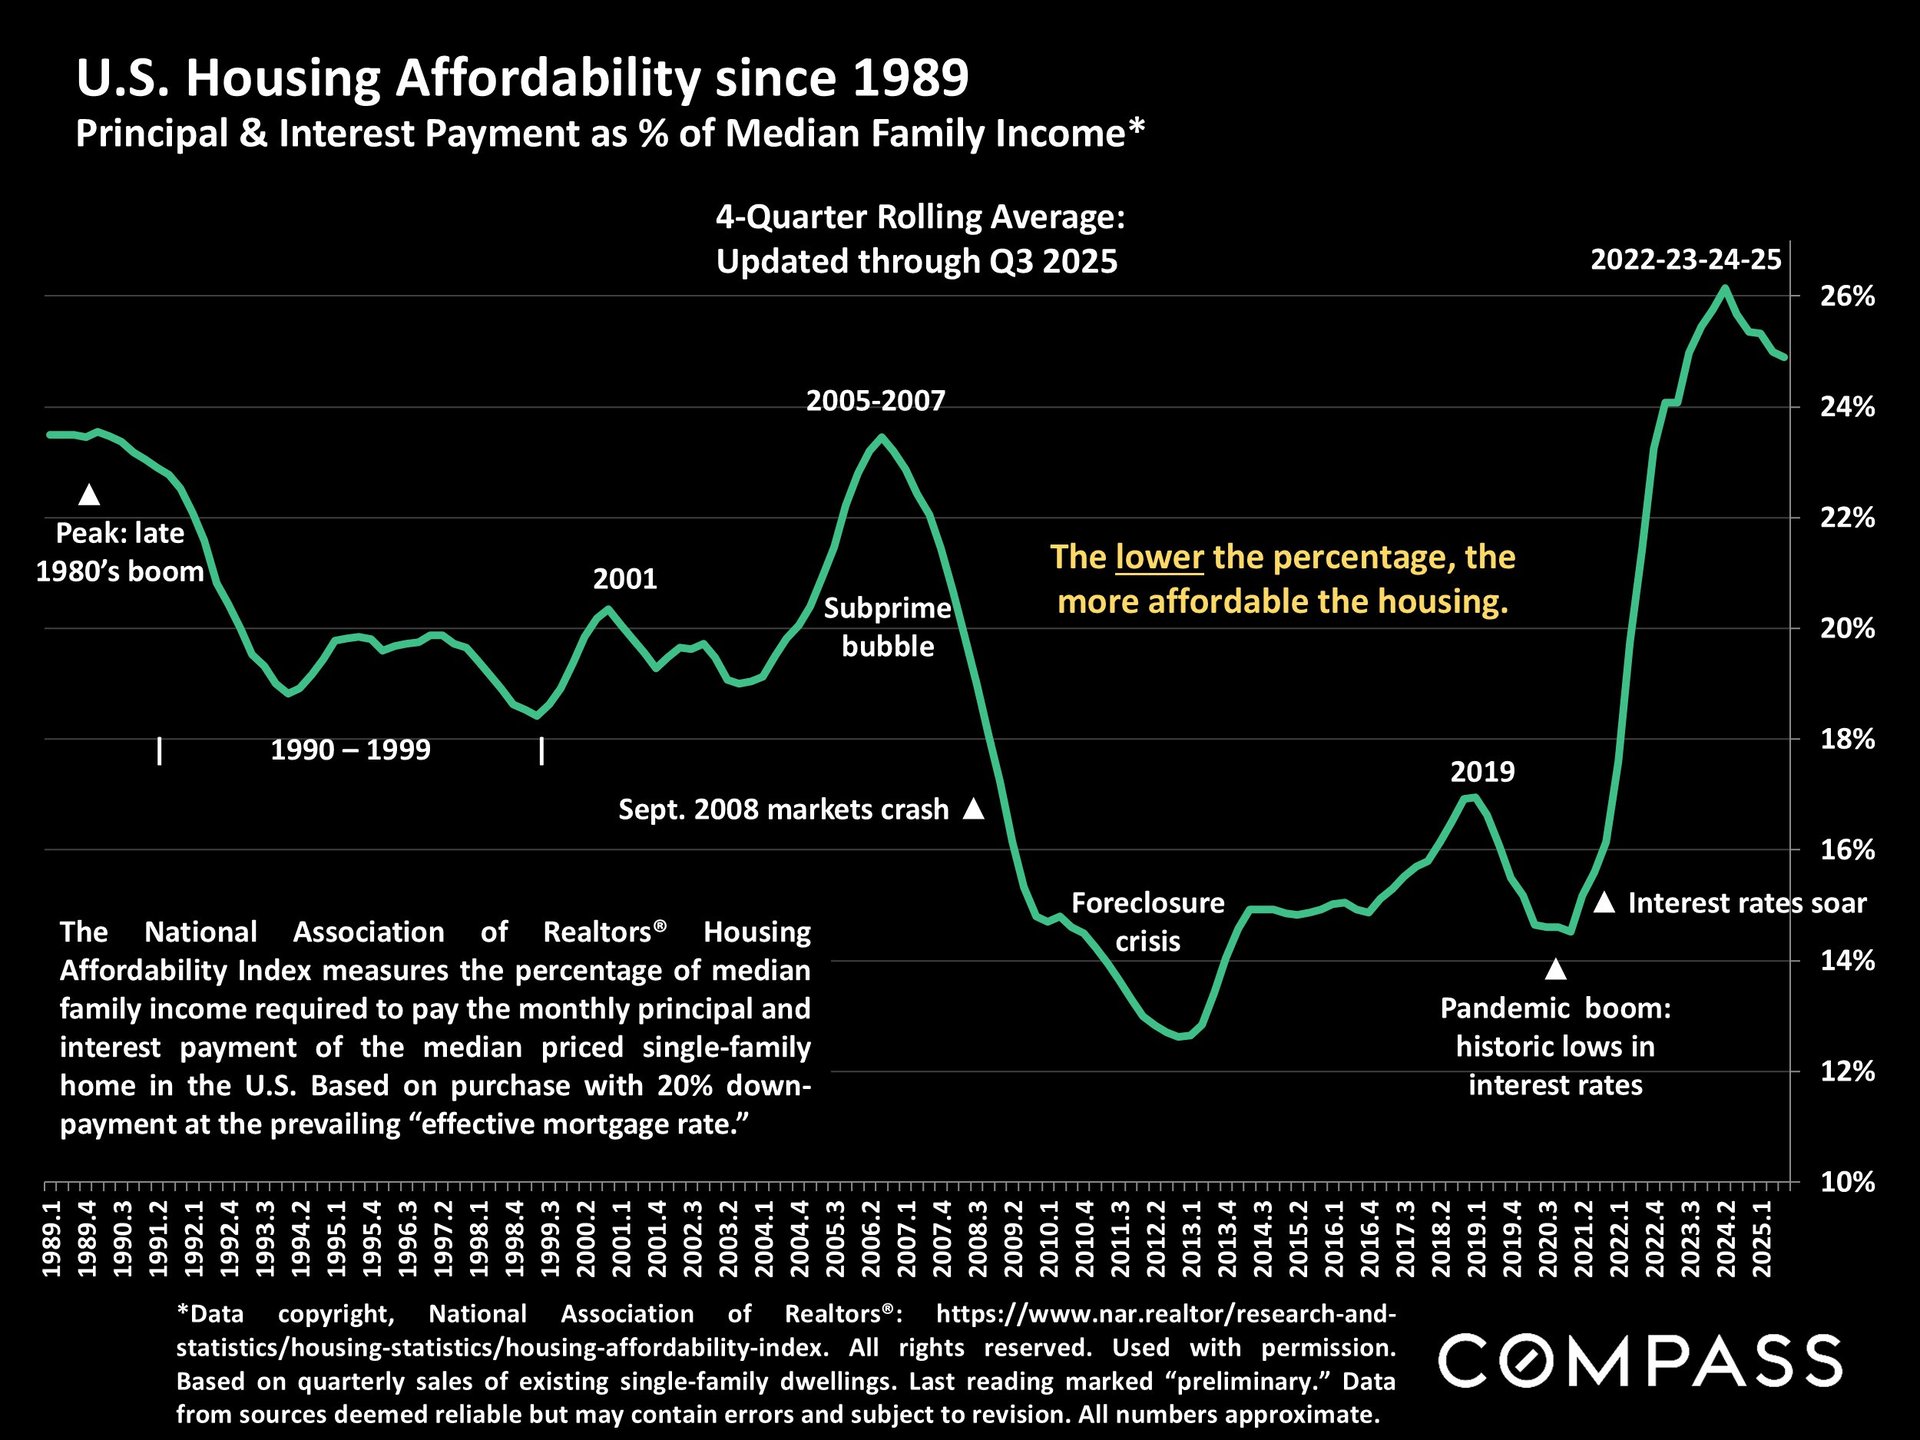
Photo Courtesy of Compass
Employment
The national unemployment rate remains low by historical standards but has been trending upward, a factor the Federal Reserve weighs carefully.
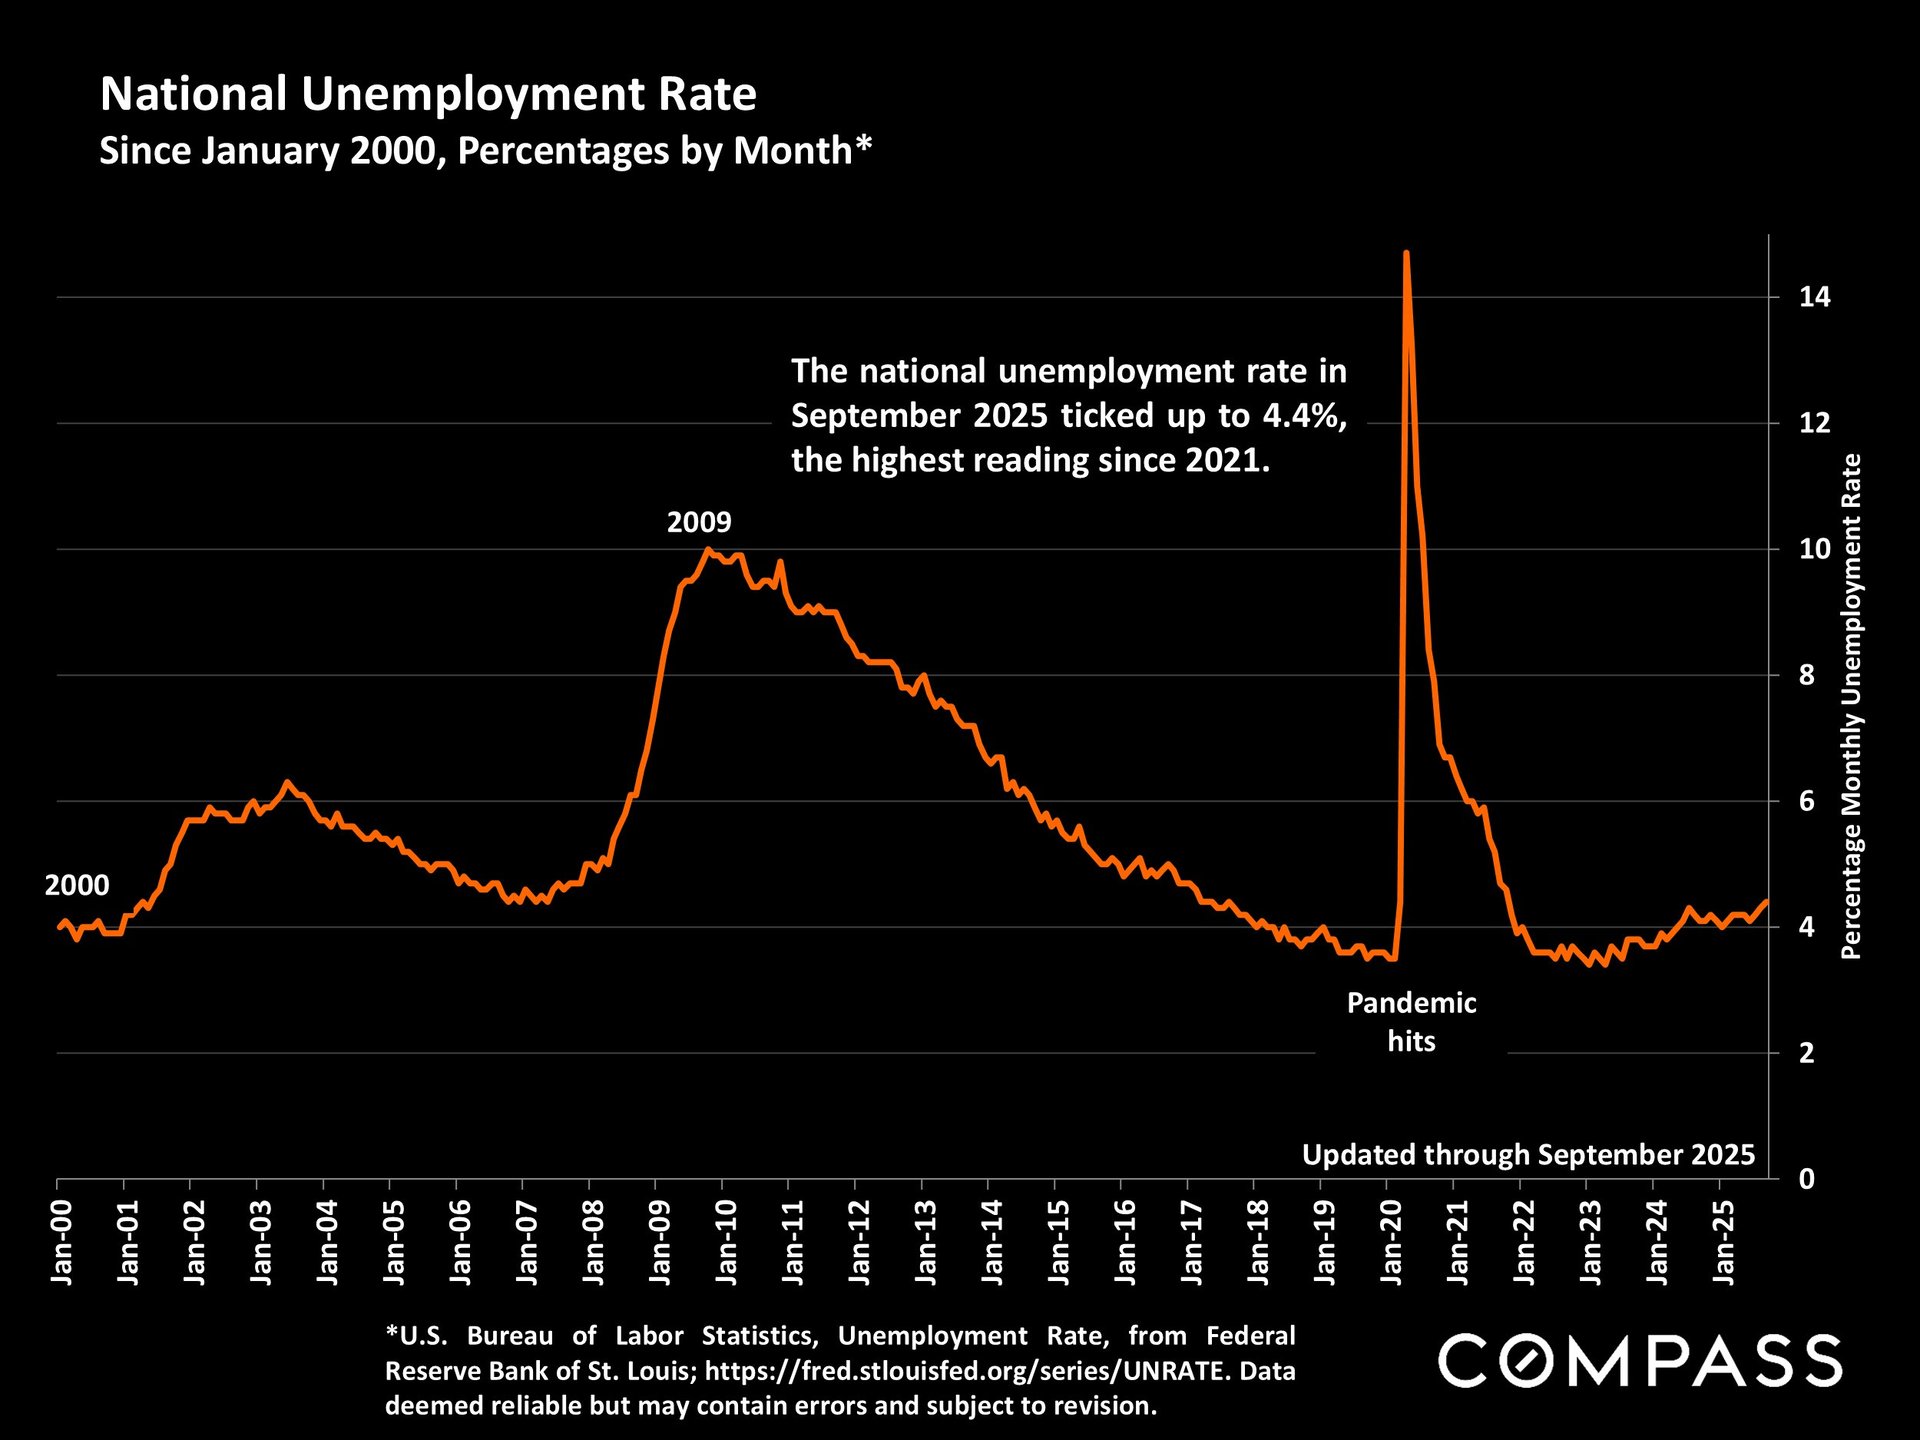
Photo Courtesy of Compass
Federal Reserve Rate Decisions
A chart of benchmark Fed rate changes since 1981 illustrates just how unusual the last five years have been. With only two small cuts so far in 2025, economists are split on whether the Fed will move again in December—or hold until after the 2026 outlook becomes clearer. Political conditions, inflation data, labor trends, and global economic pressures all remain in play.
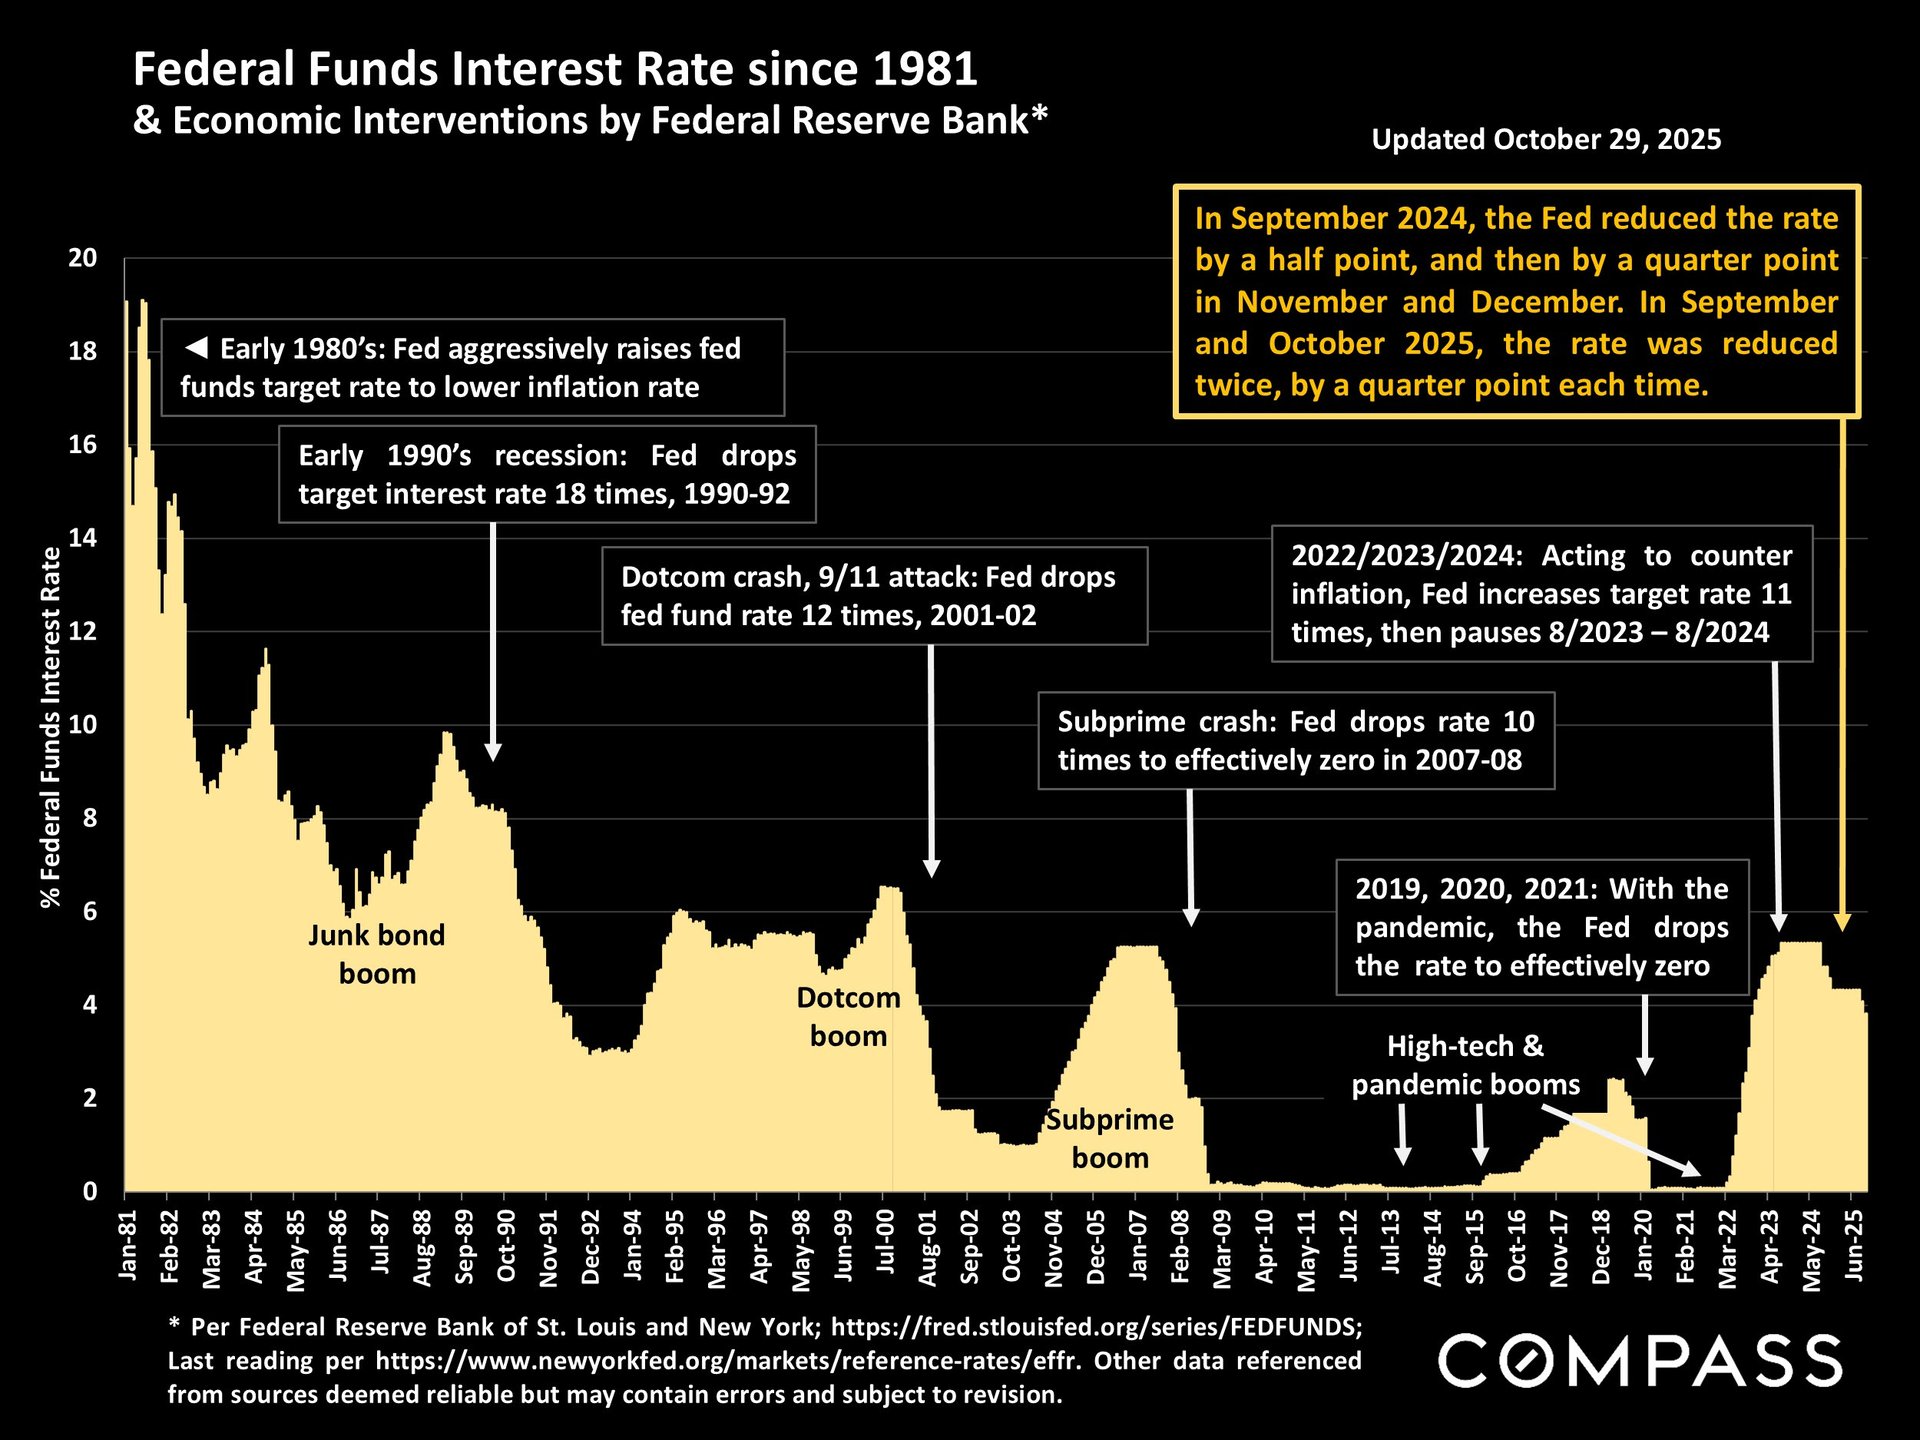
Photo Courtesy of Compass
Final Thoughts
The U.S. housing market at the end of 2025 is a complex mix: improving affordability, rising inventory, uneven regional price performance, and cautious optimism among buyers and sellers alike. While headwinds remain—especially around long-term supply and affordability—many indicators point to a market finding a new equilibrium after years of turbulence.
The Blackshaw Messel Group’s team of real estate advisors is here to provide clear, data-driven guidance—whether you’d like a localized market breakdown, deeper insight into the NAR report, or a personalized analysis tailored to your real estate goals. Reach out today!

Photo Courtesy of Something Blue Photography