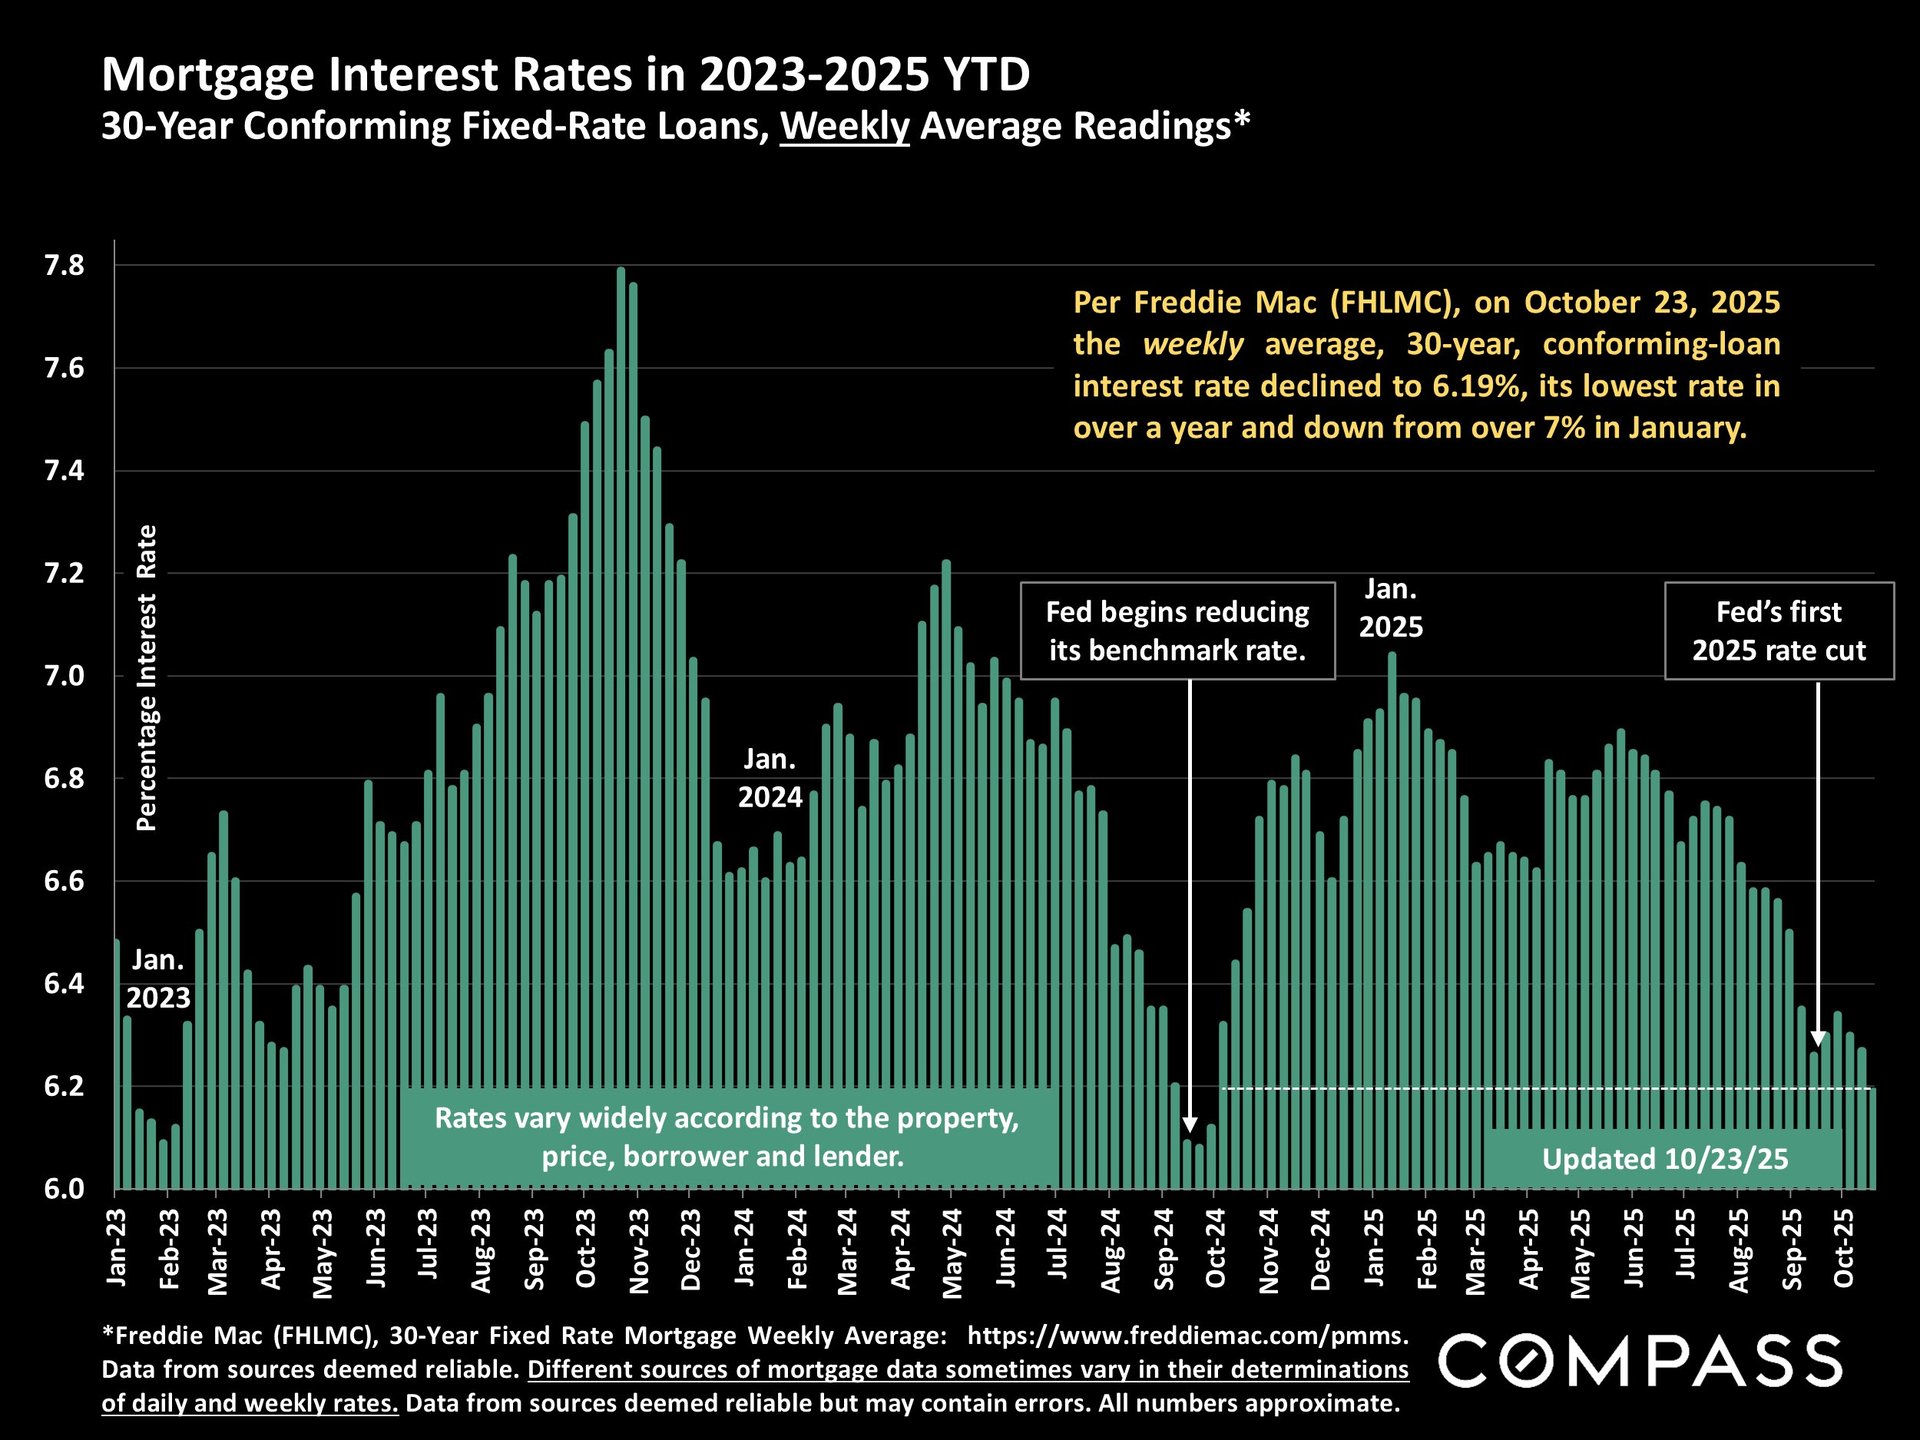
As we move through the final quarter of 2025, the national housing market is showing a fascinating mix of stability, renewed optimism, and shifting dynamics. According to the latest Compass National Real Estate Insights, the third week of October marked the lowest interest rate reading in over a year—a change that could have a major impact on buyer activity as we head into the end of the year.
Rates, Stocks, and Buyer Confidence
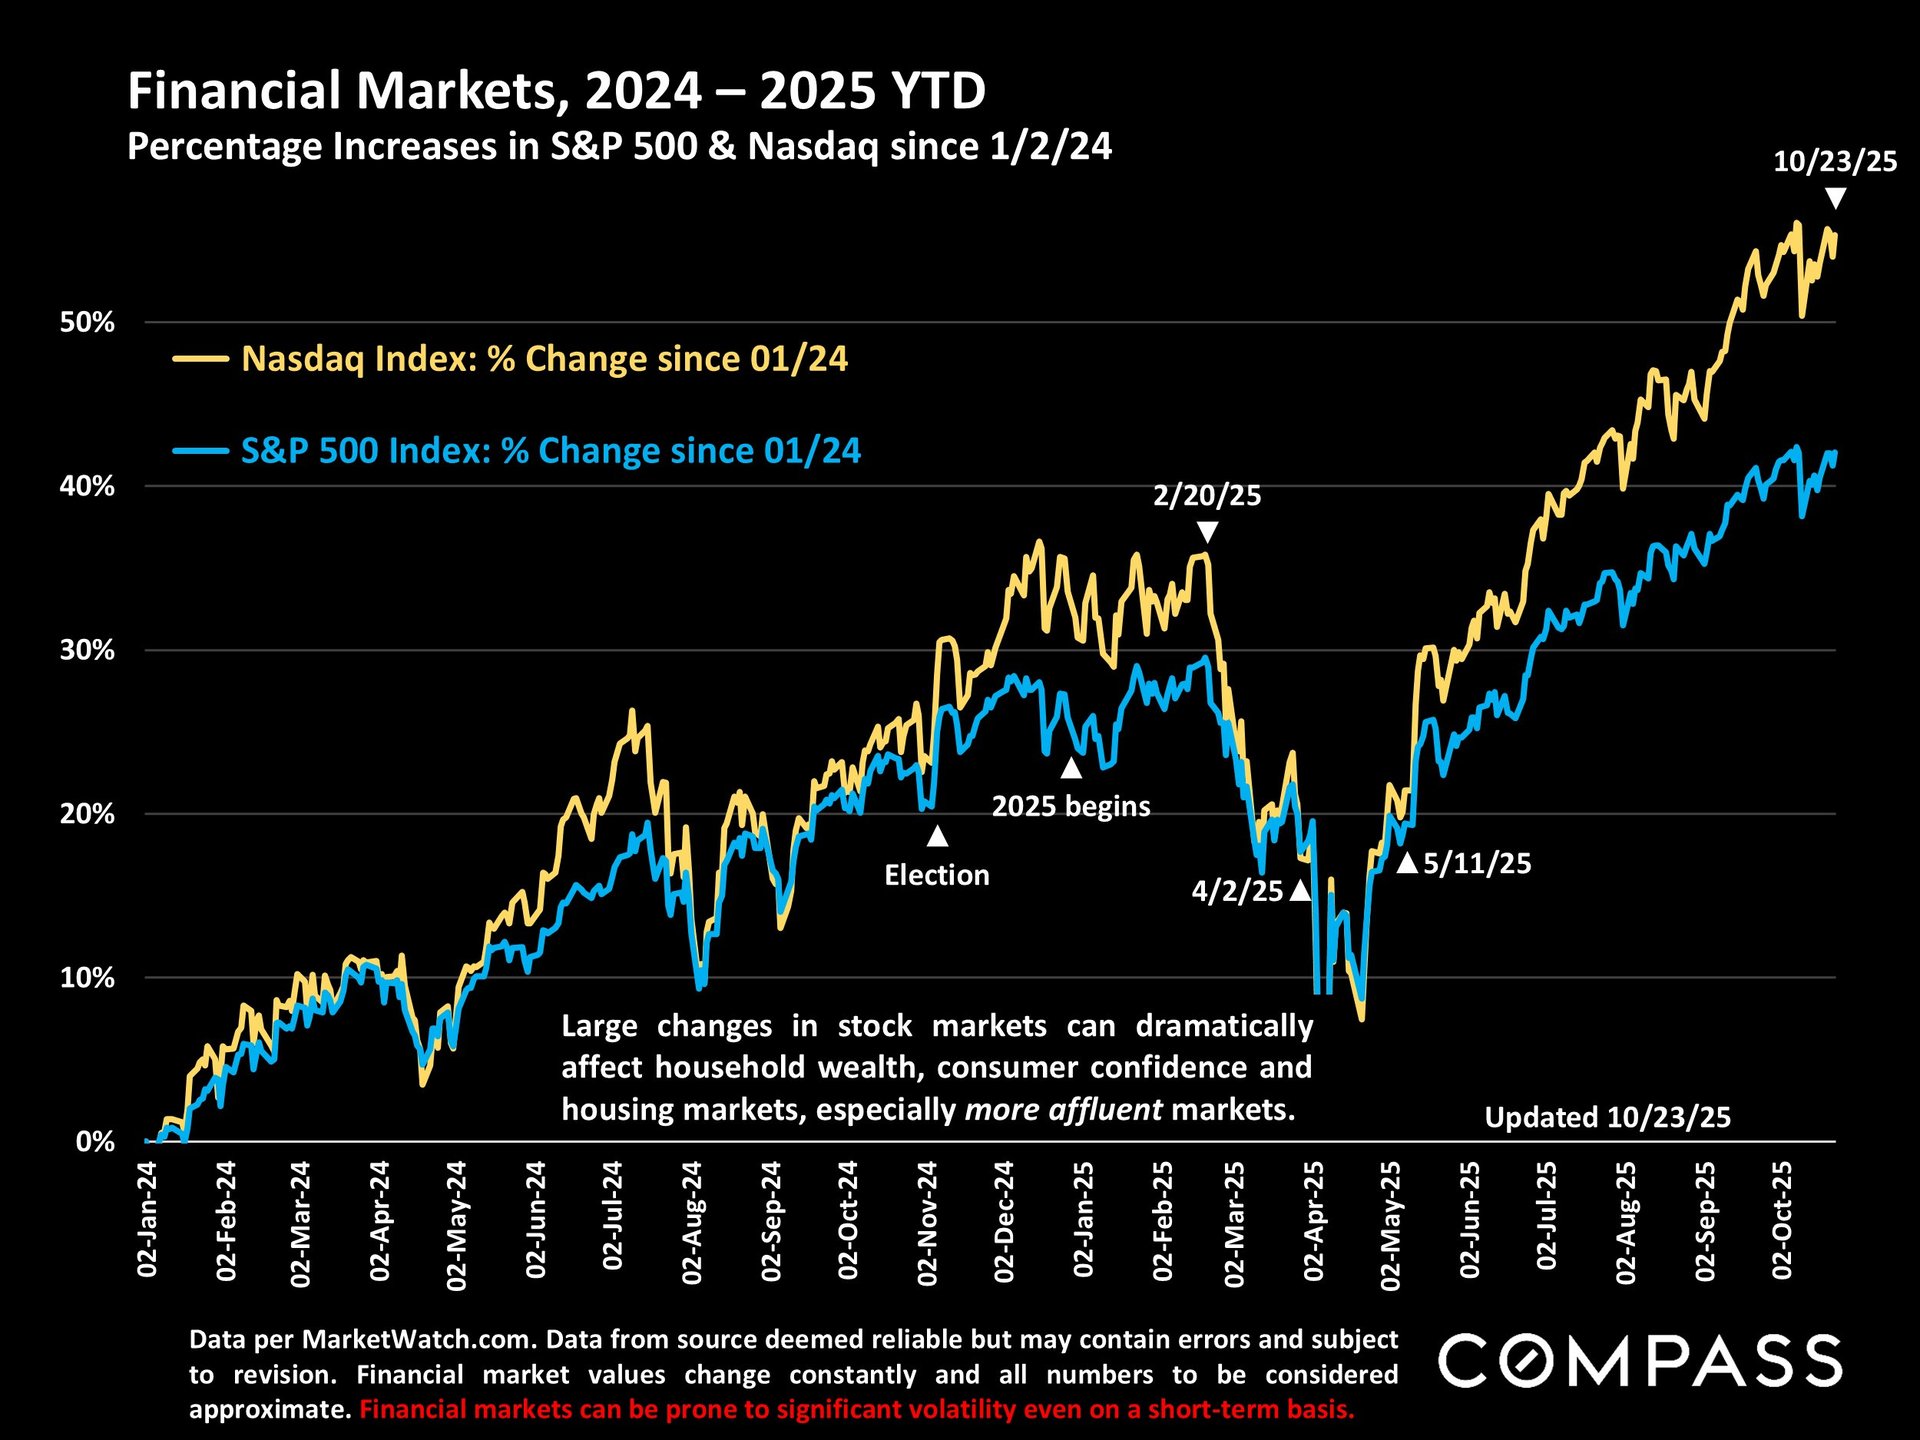
Falling mortgage rates often reignite buyer enthusiasm, and if the trend continues, we could see a meaningful bump in demand throughout Q4. Meanwhile, stock markets remain near their September peaks, bolstering consumer confidence and household wealth—factors that often spill over into real estate decision-making.
Photos Courtesy of Compass
Pricing Trends and Inventory Levels
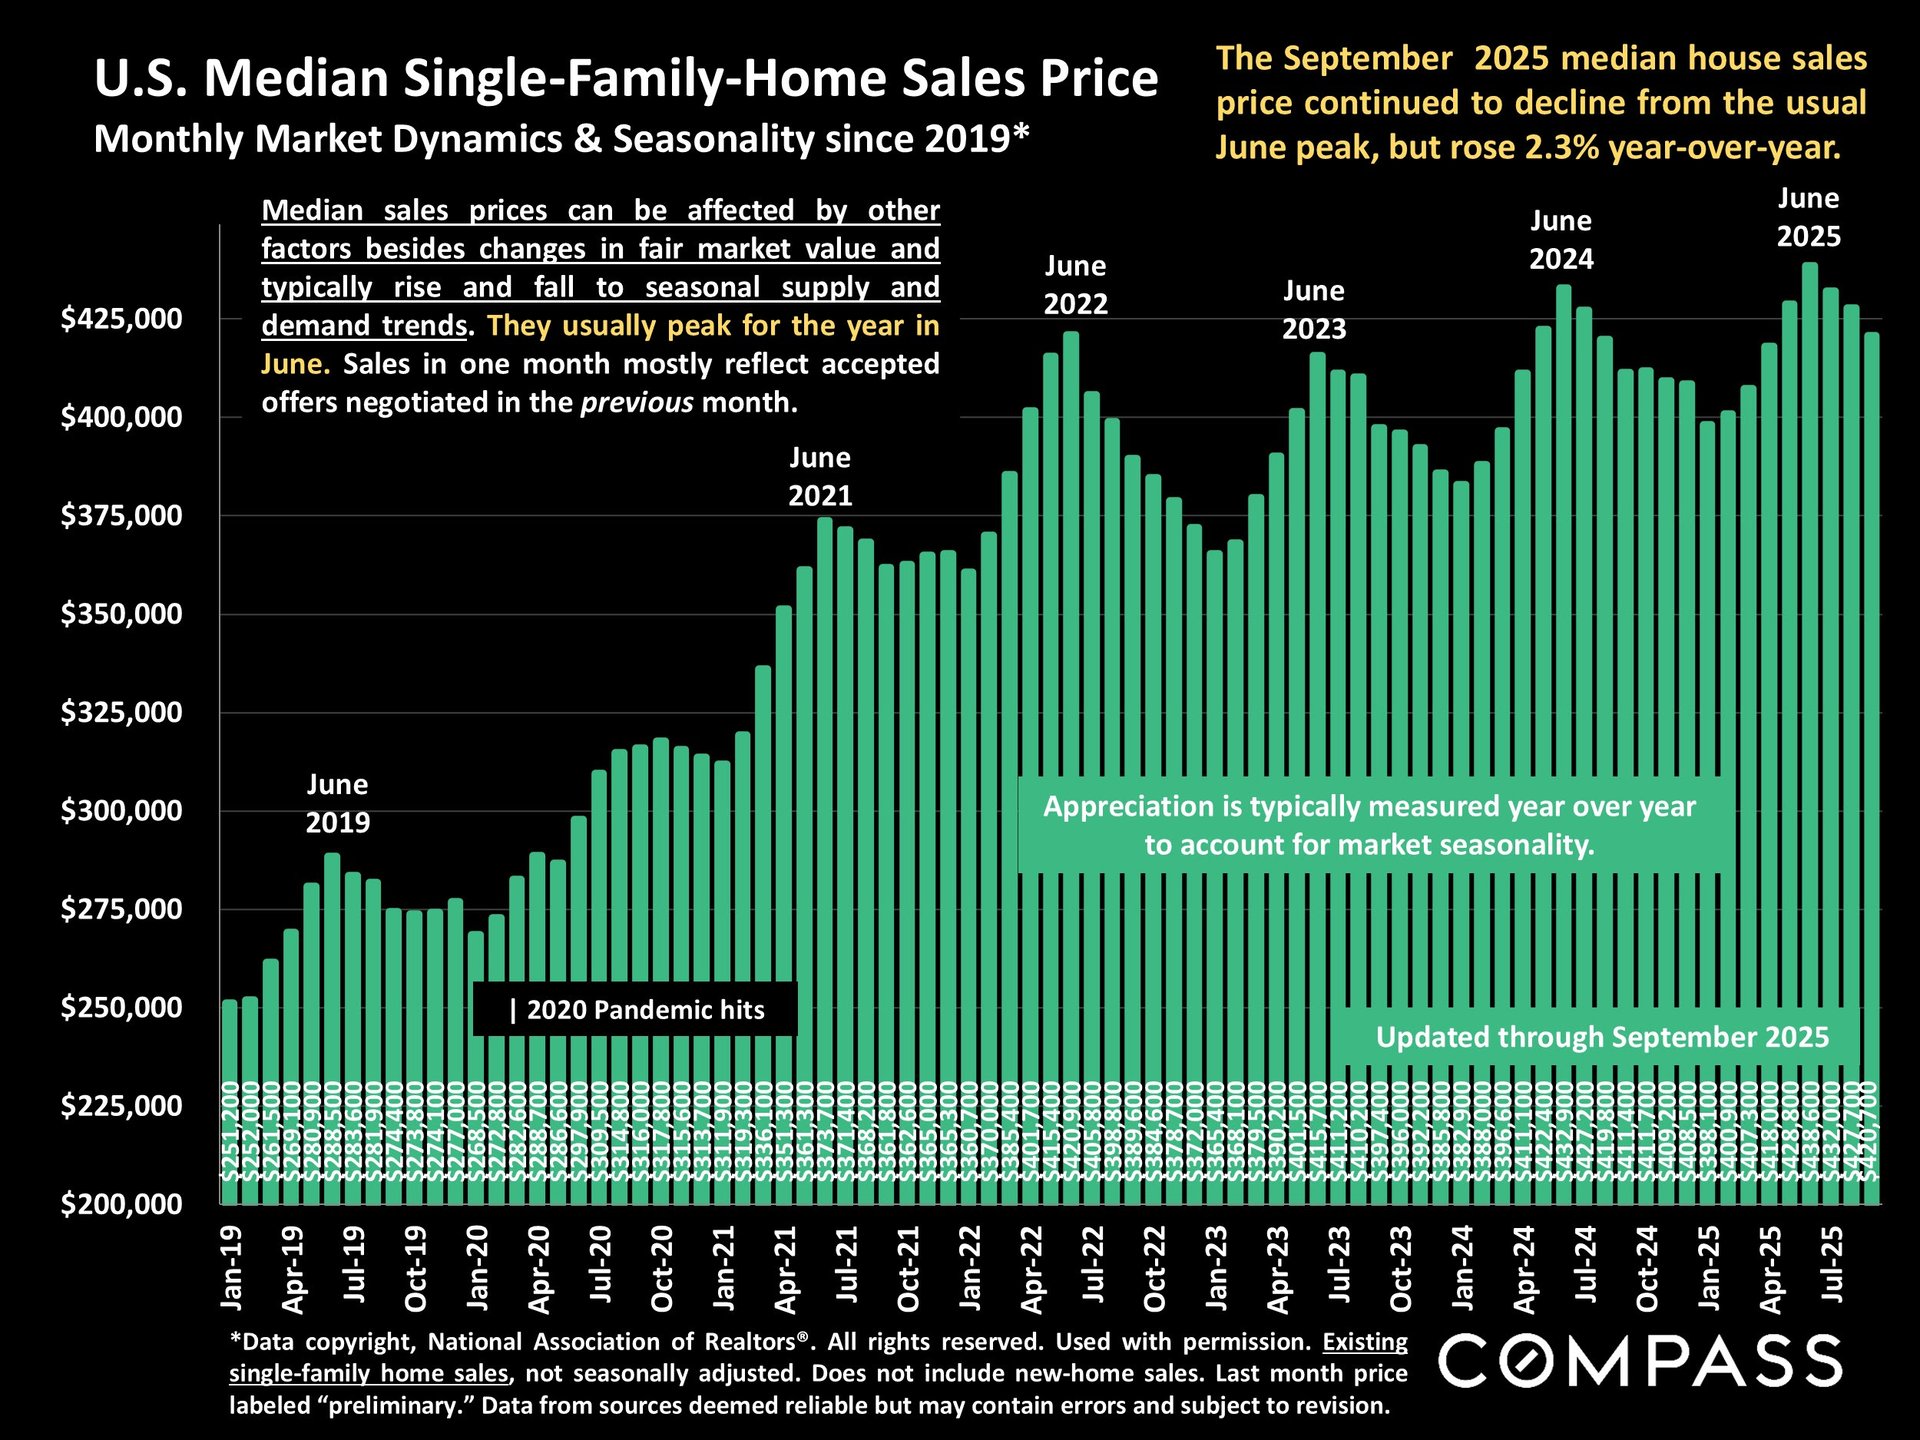
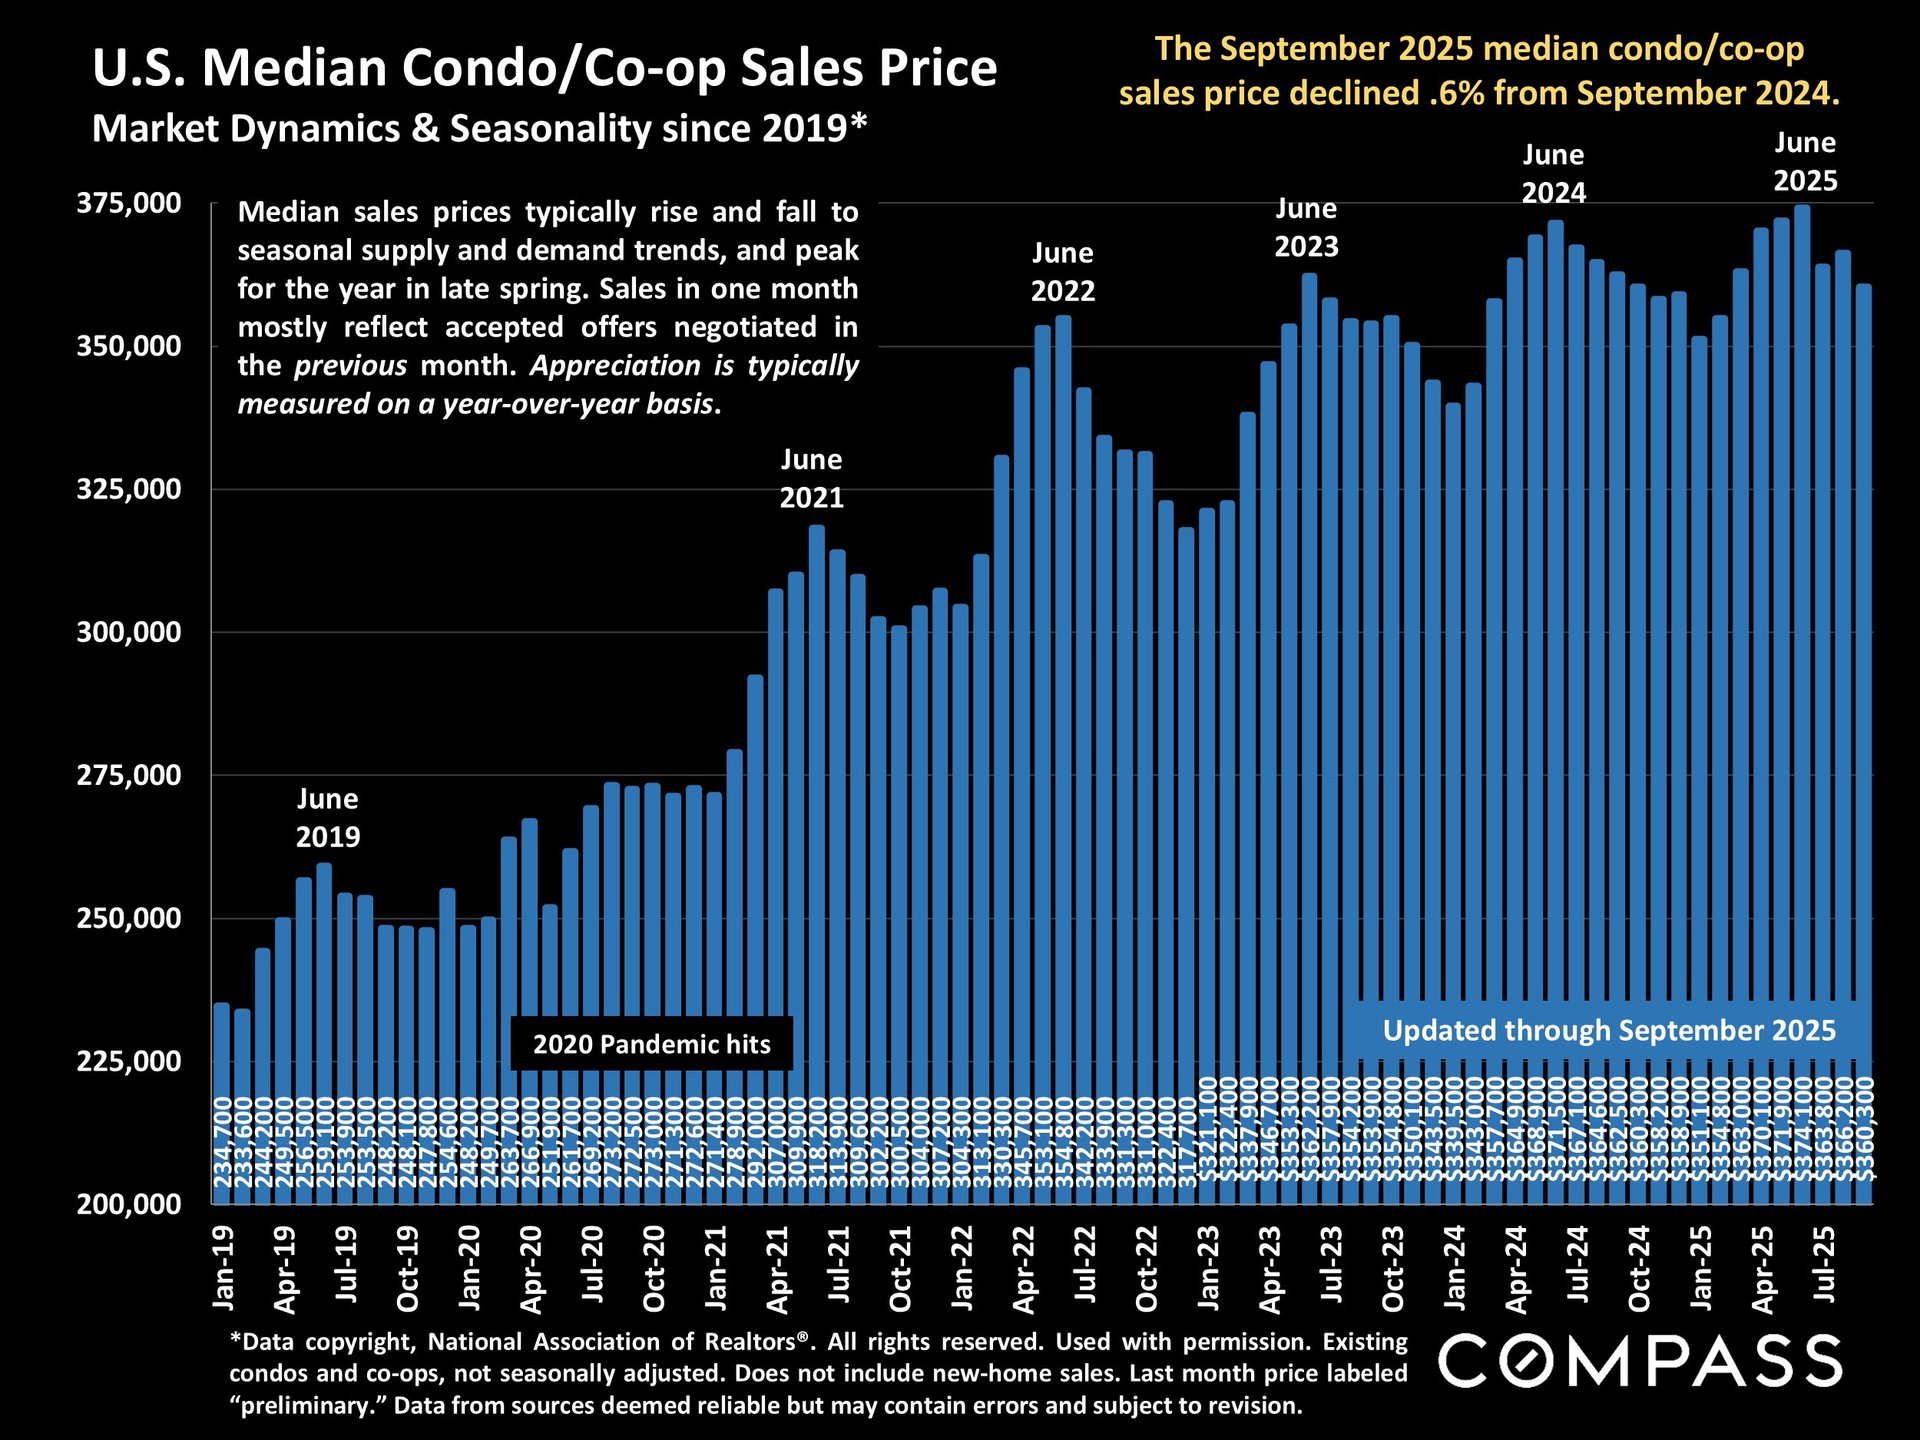
After peaking in June, median home prices have eased slightly. Year-over-year, the median single-family home price is up 2.3%, while condo and co-op prices are down just 0.6%.
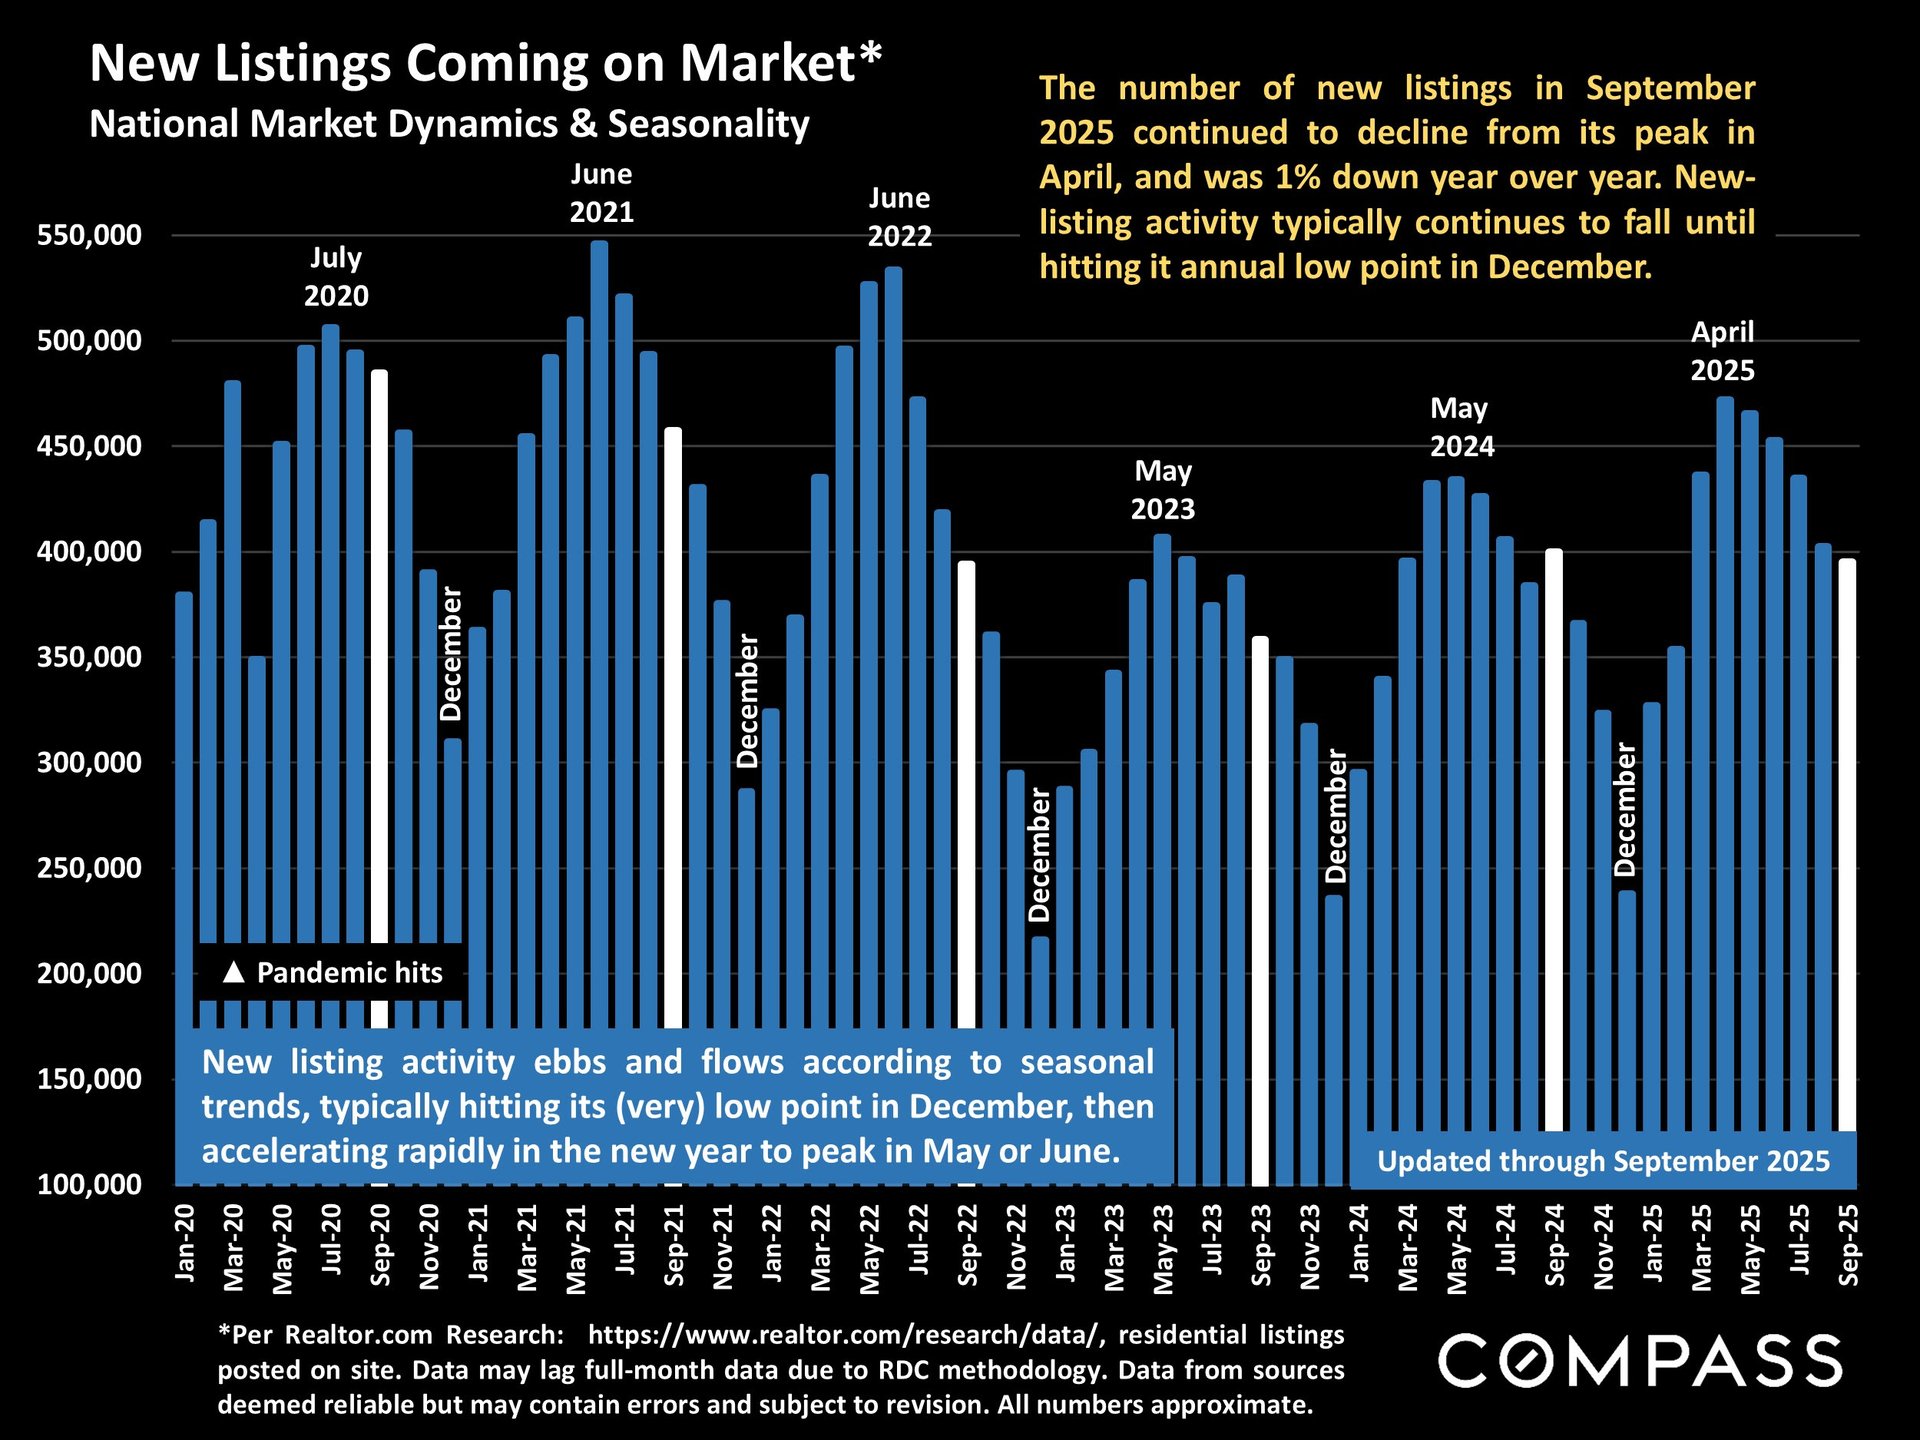
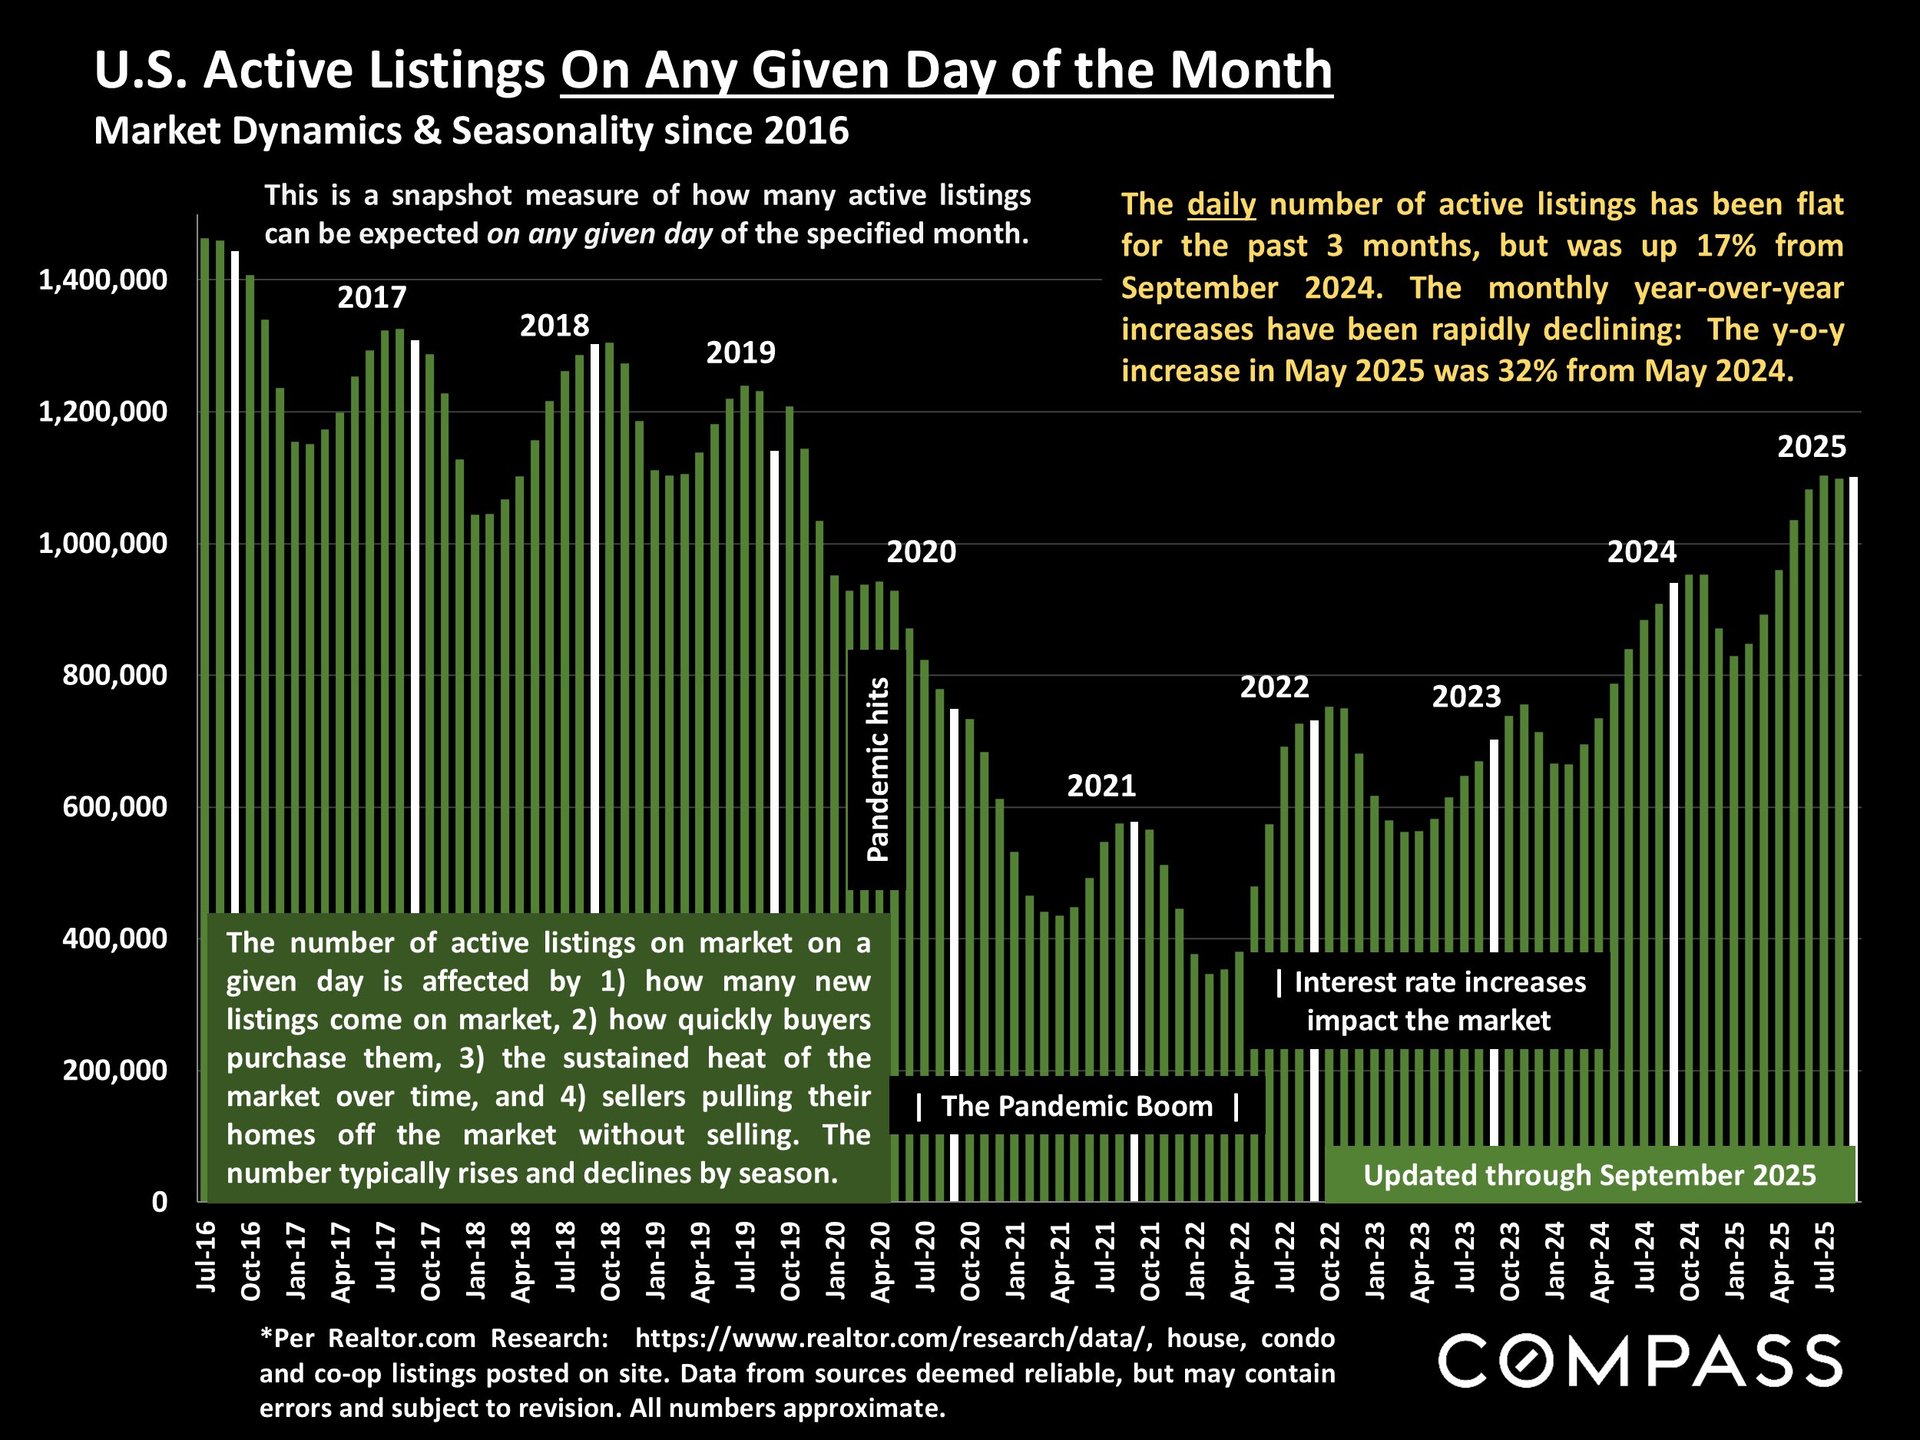
Inventory remains one of the defining stories of the year. While the number of active listings in September was up 17% from September 2024, it stayed relatively flat compared to July and August. This marks the highest level of available inventory since 2019, though the pace of increase has begun to slow.
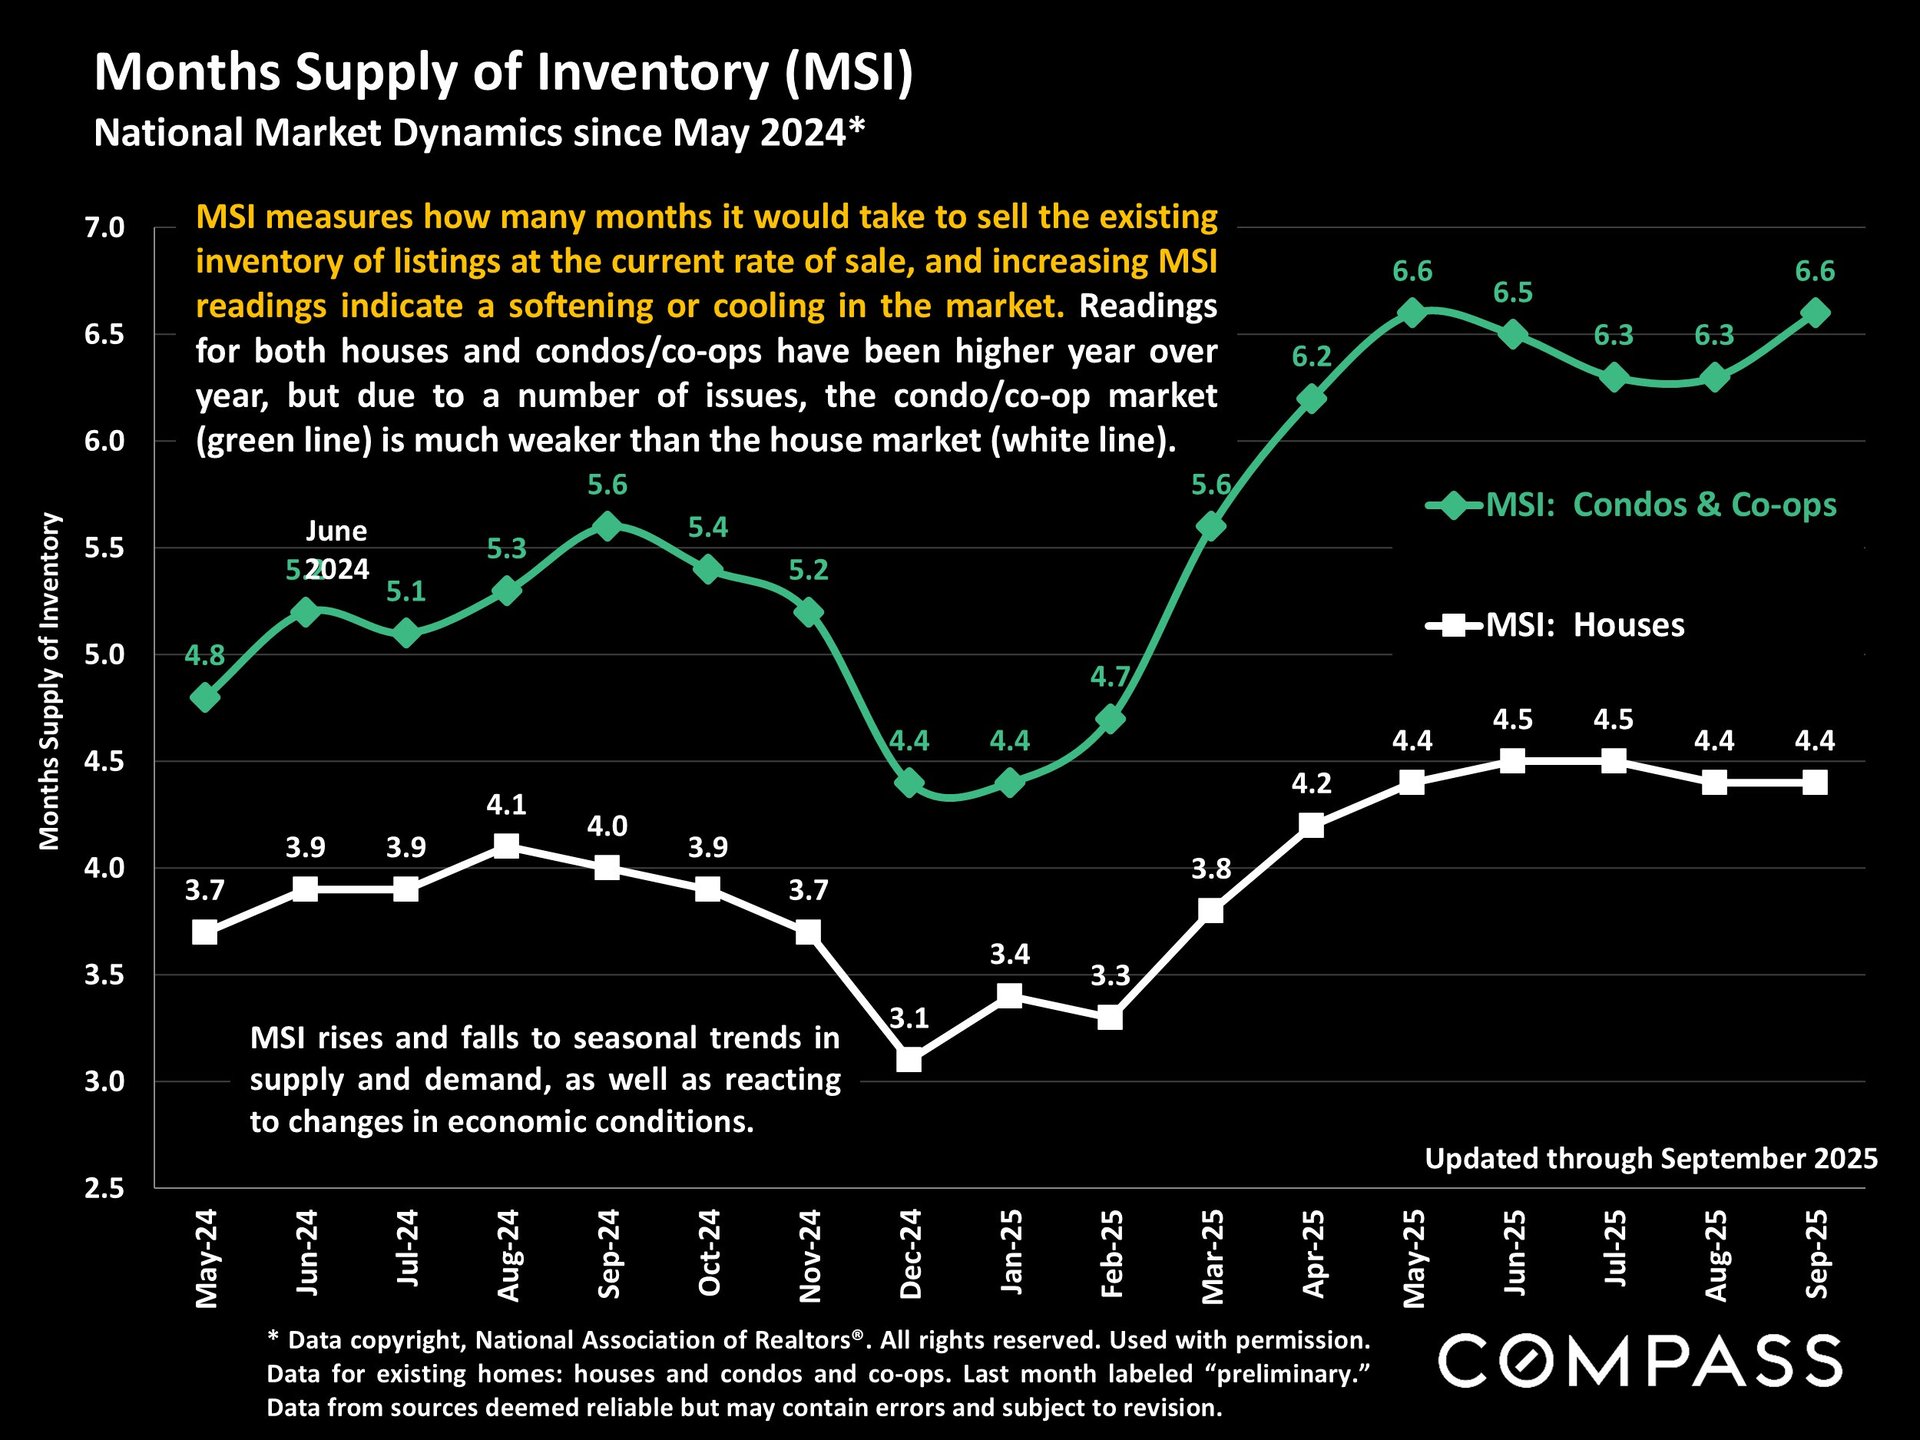
The months-supply-of-inventory (MSI) metric—used to gauge the balance between supply and demand—remains elevated year-over-year. Detached single-family homes continue to show stronger demand compared to the condo and co-op market, where conditions have softened more notably.
Photos Courtesy of Compass
Sales Activity and Price Segments
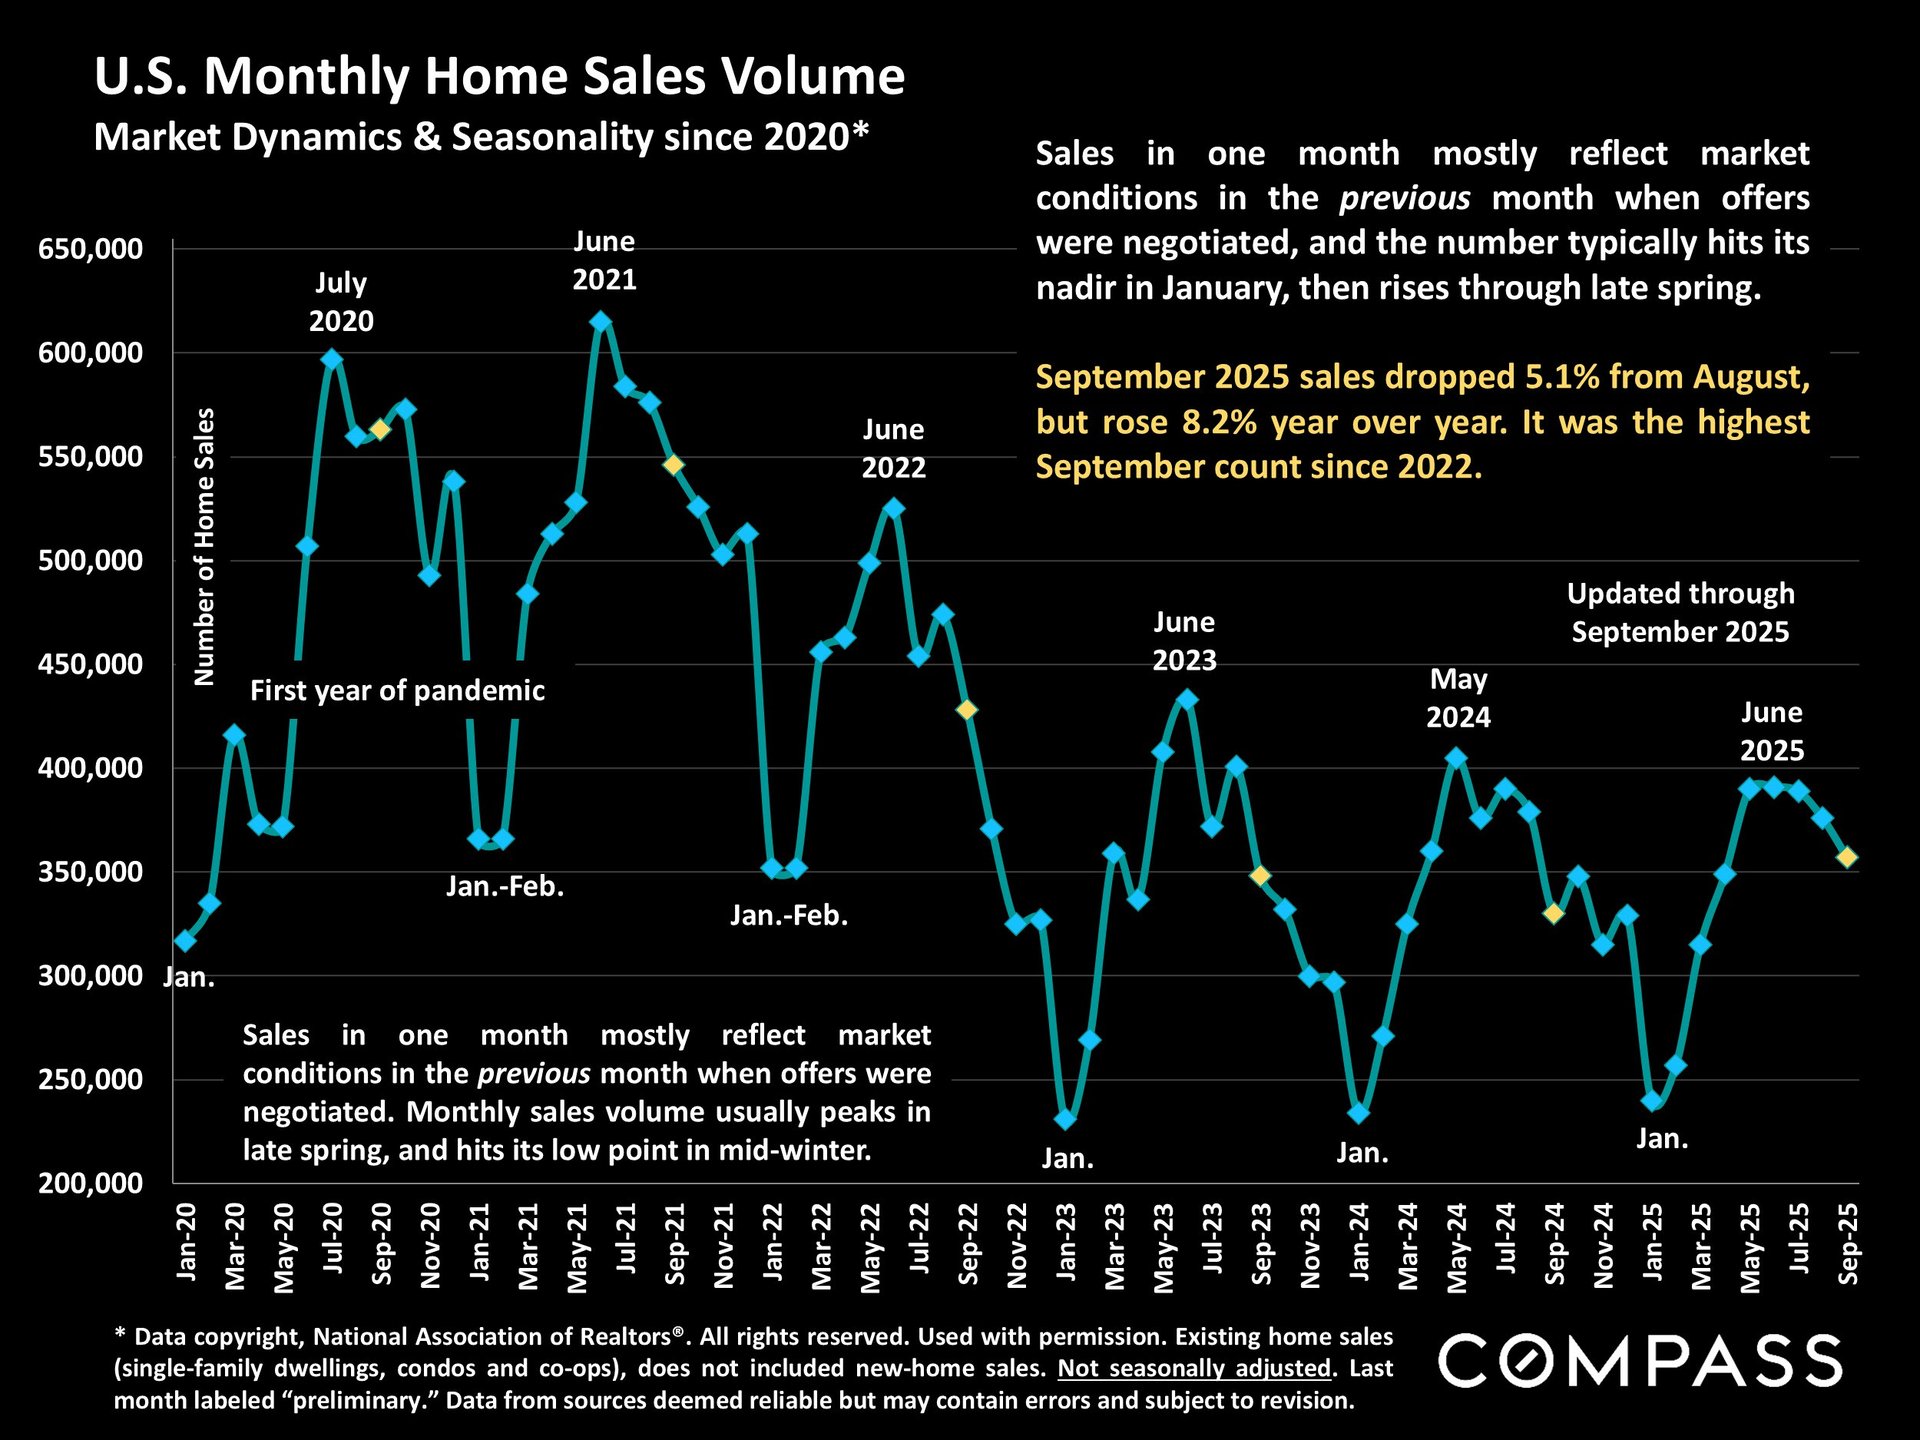
September’s home sales dipped slightly from August, which is typical for the season, but they were still up more than 8% from last year. Given that most closings reflect contracts written a month earlier, we could see a rebound in October and November sales in response to lower mortgage rates.
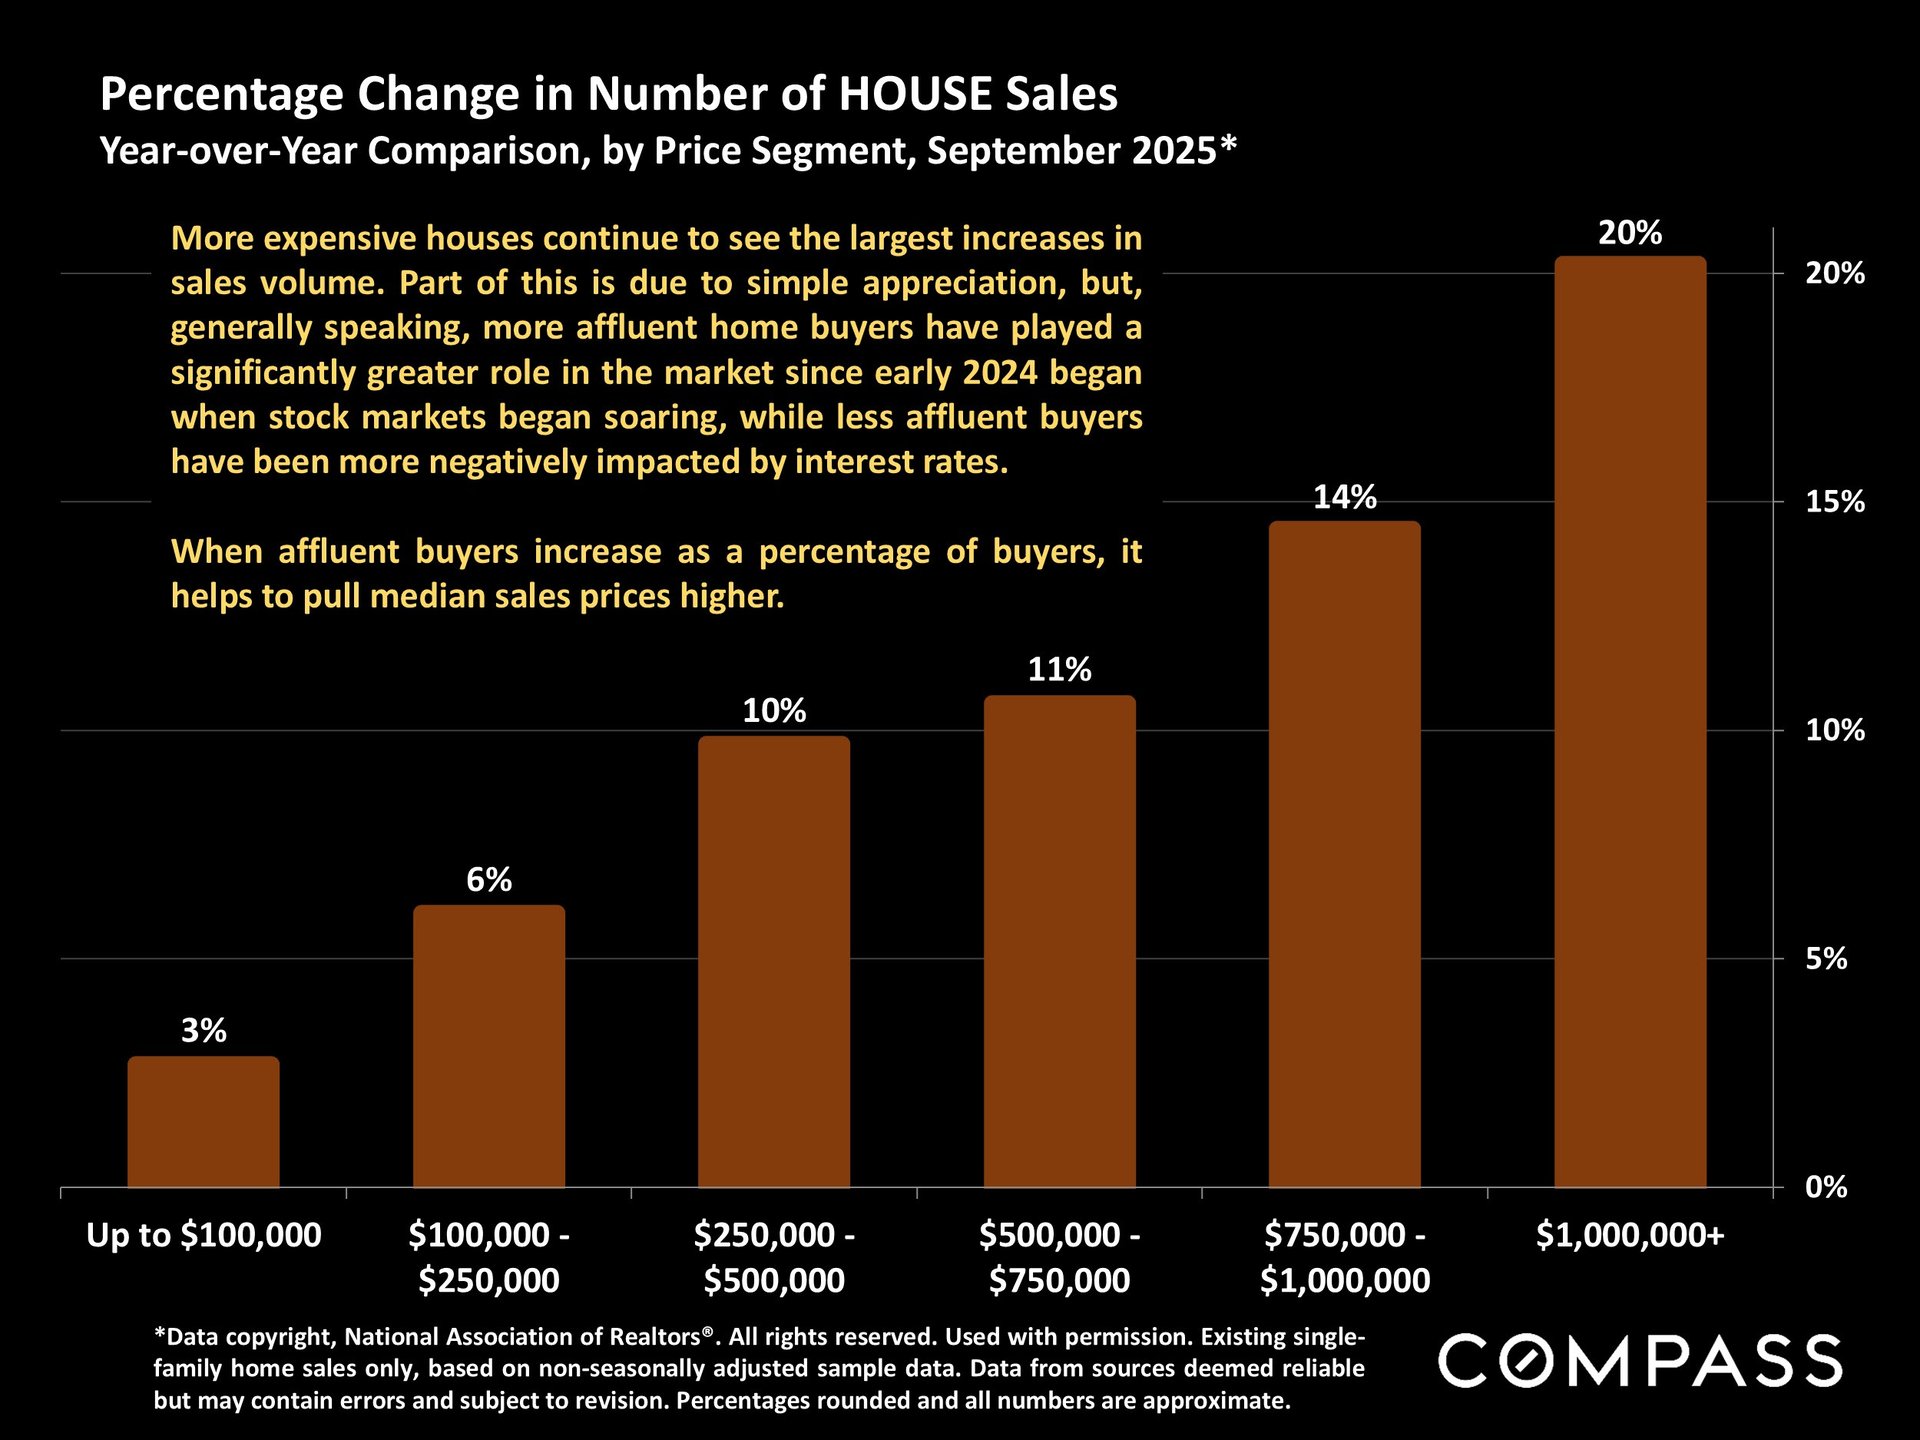
Interestingly, higher-priced homes have seen a faster increase in sales activity compared to more affordable segments. Nationally, the highest bracket tracked—homes over $1 million—has shown significant momentum. In ultra-luxury markets, homes priced above $5 million are driving some of the largest year-over-year gains.
Photos Courtesy of Compass
Cash Purchases and Price Adjustments
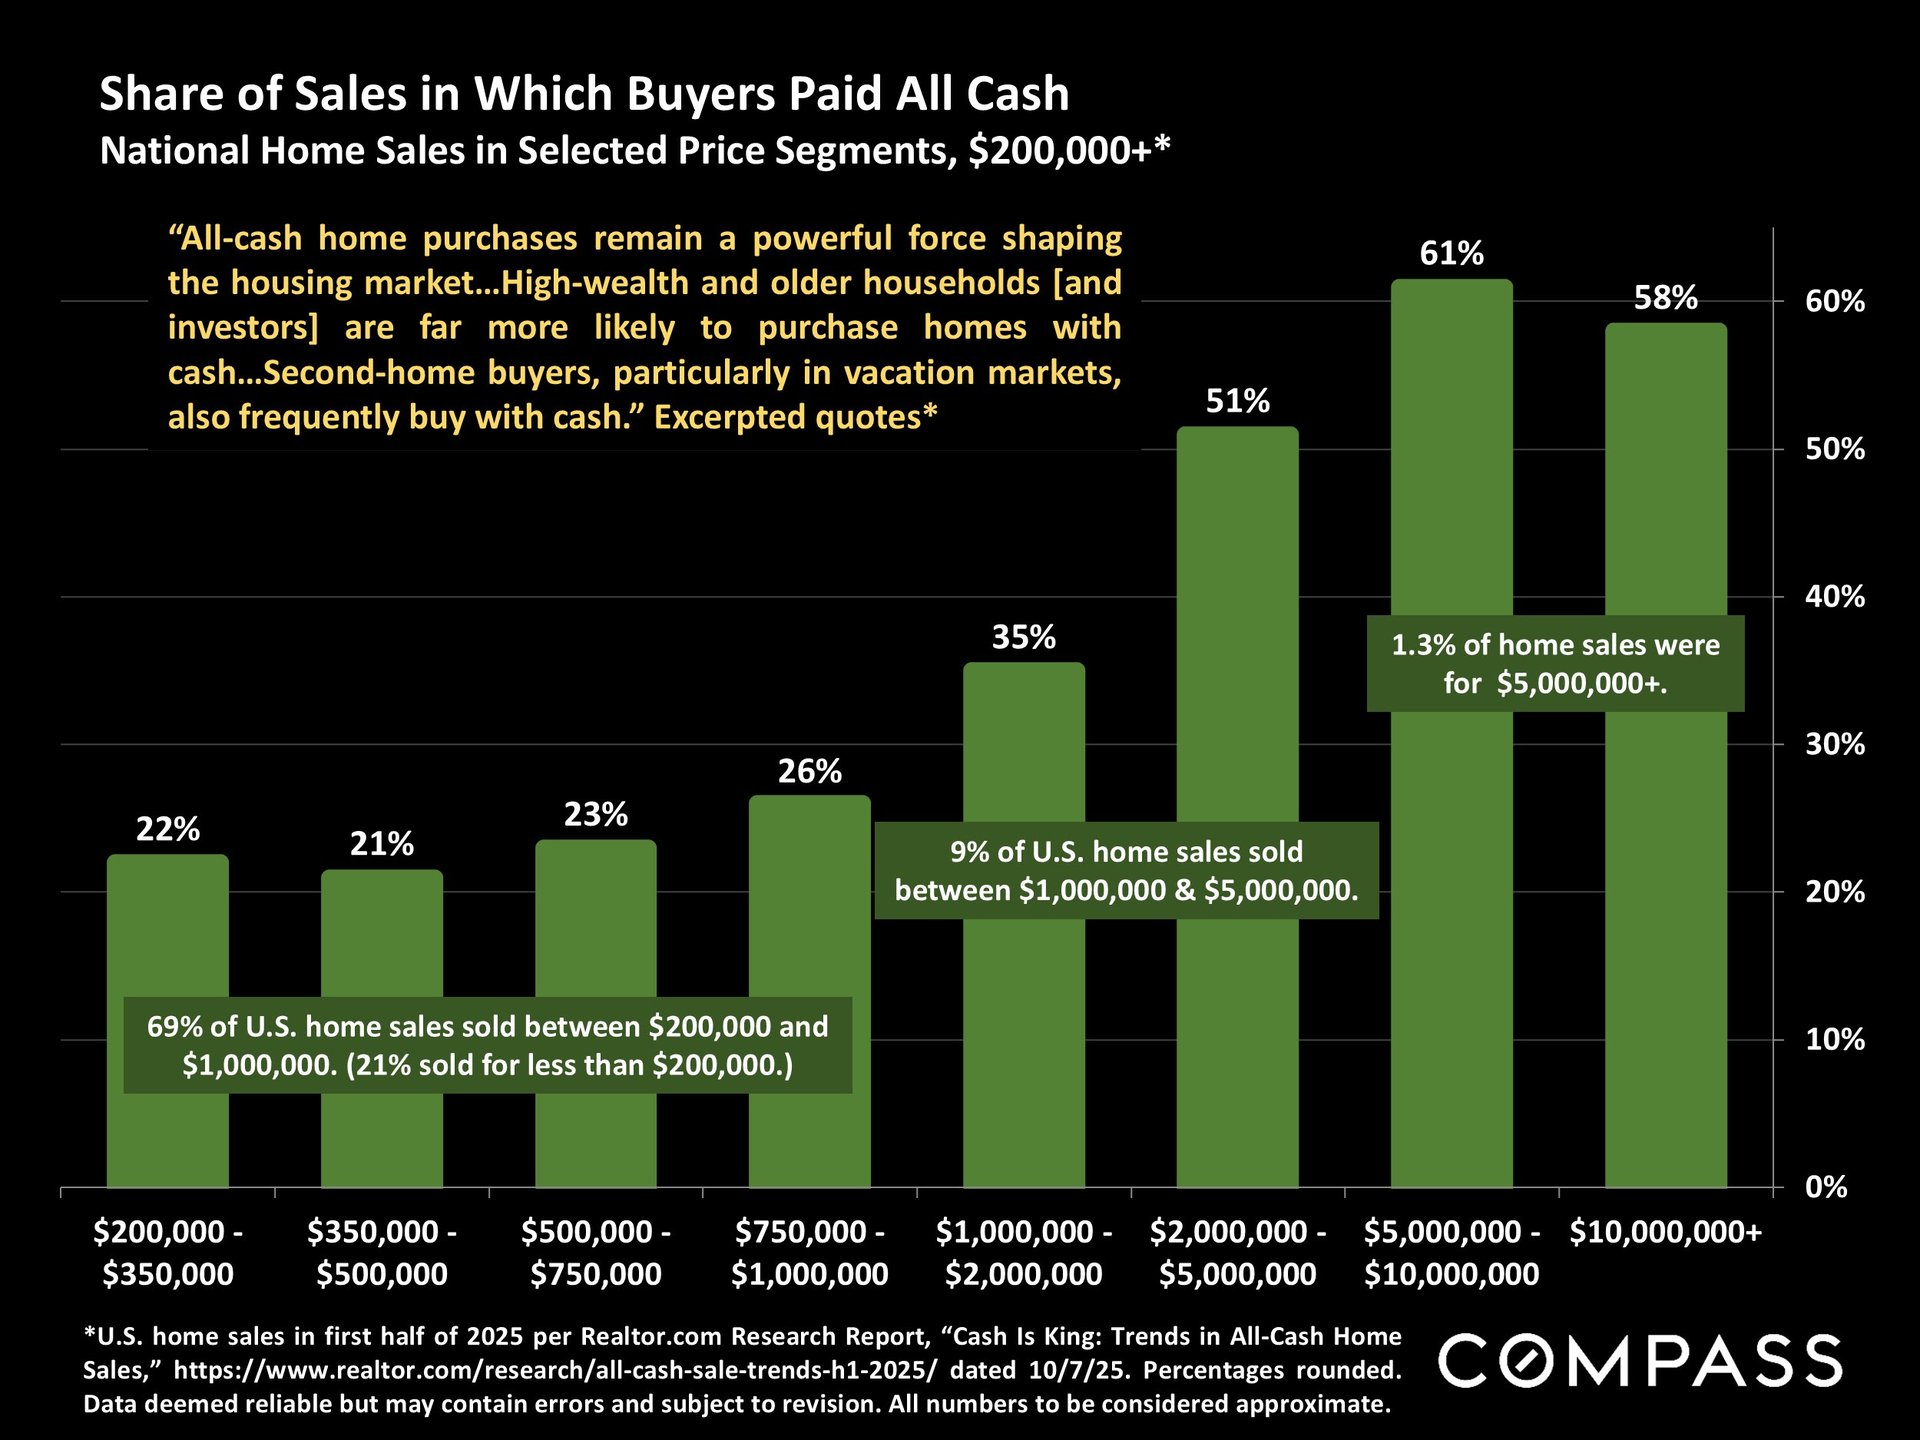
Affluent buyers continue to shape market dynamics. More than half of homes priced at $2 million or higher have sold without financing, highlighting the strength of cash-driven transactions.
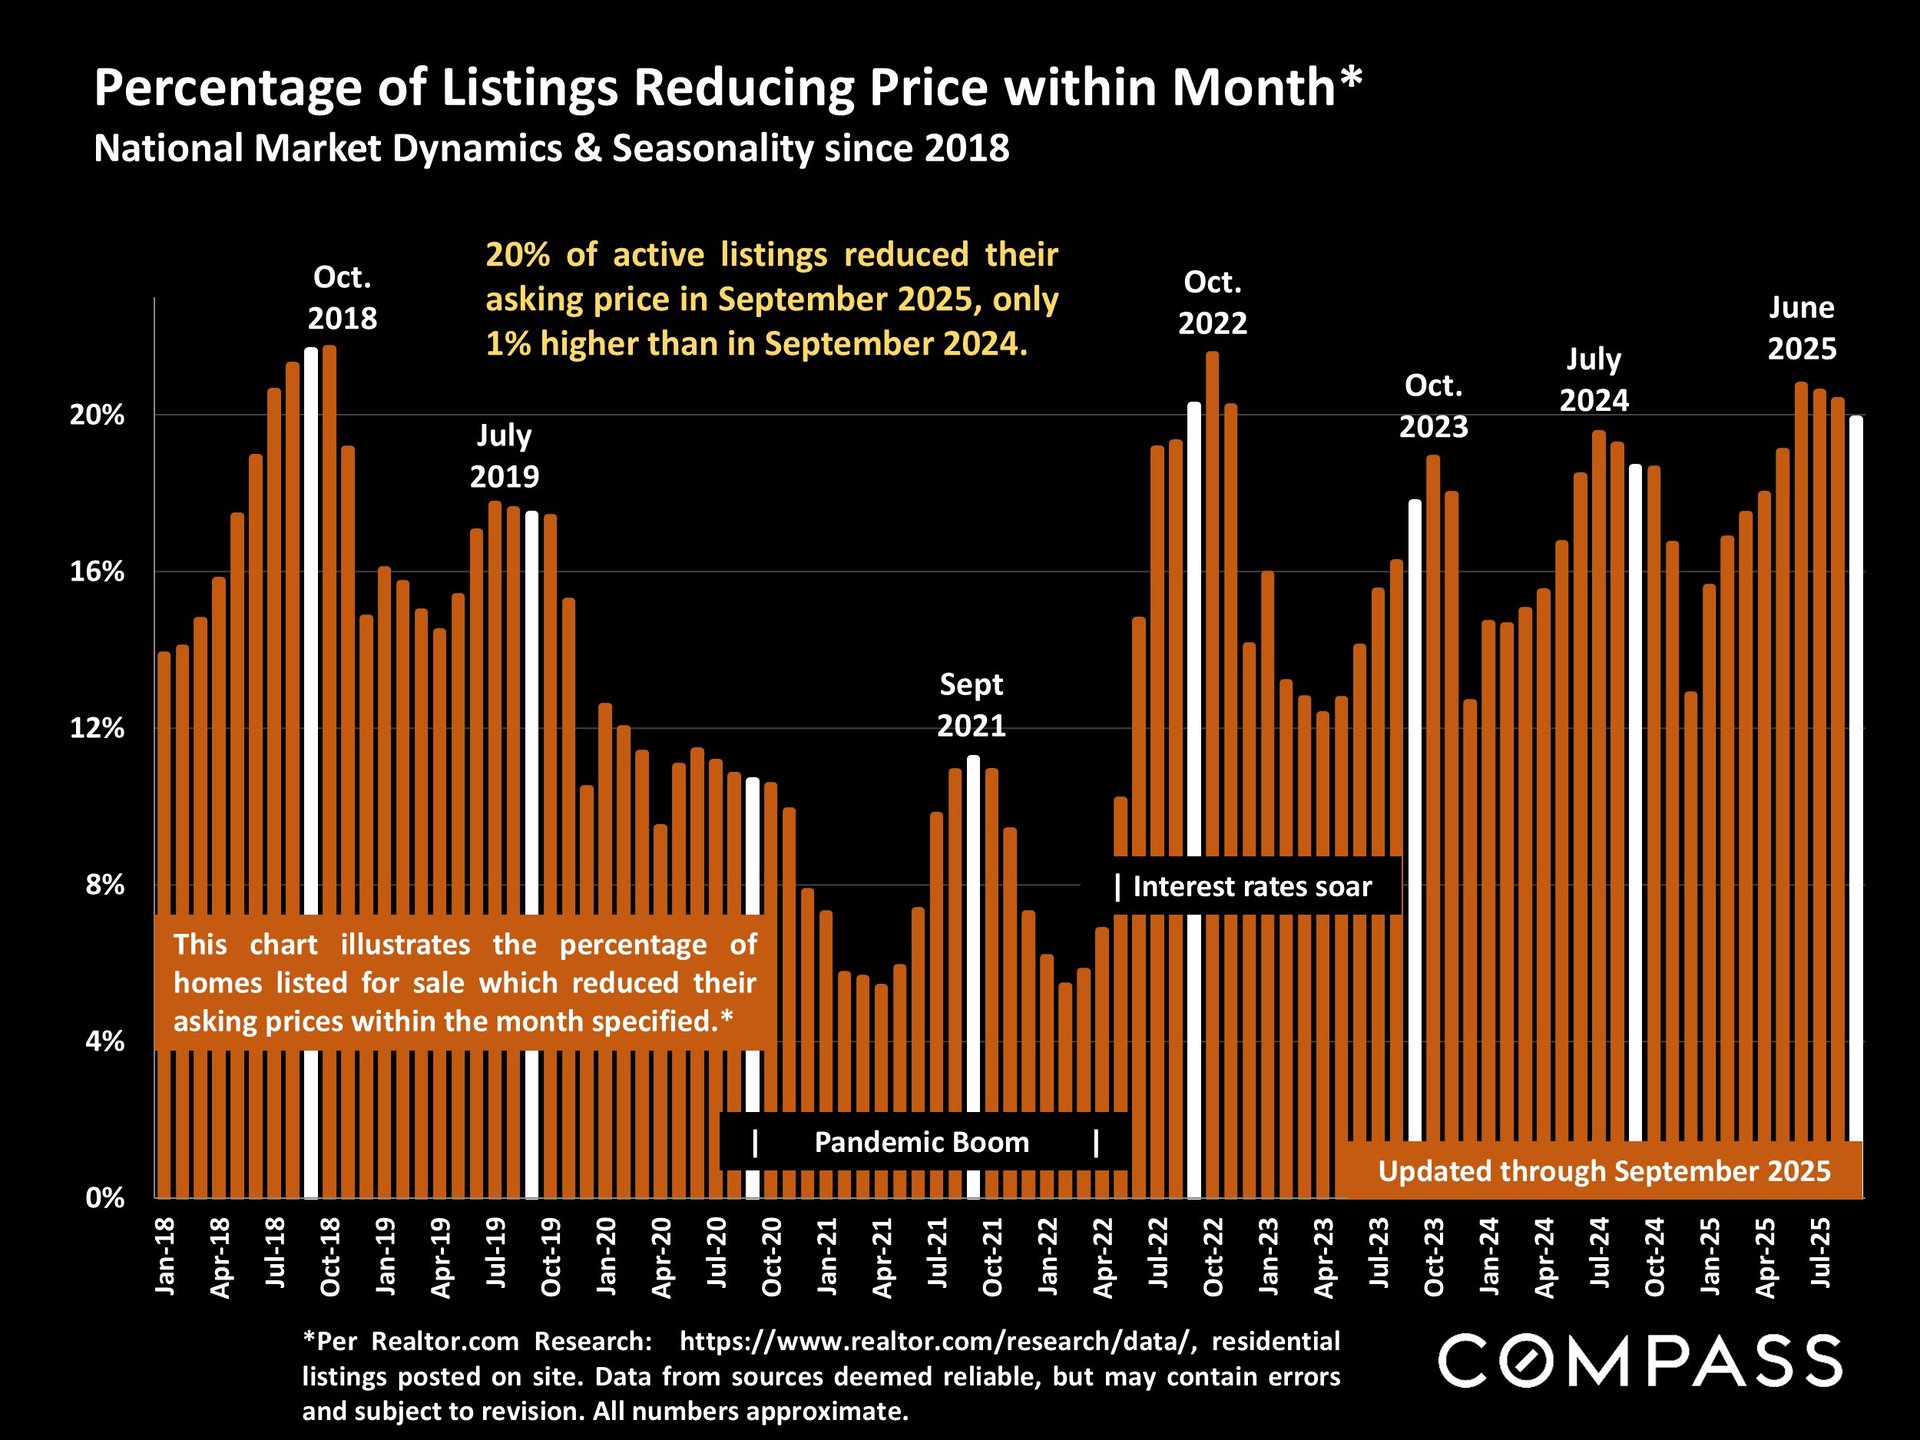
At the same time, price reductions are becoming less common. The share of listings cutting their asking price has been declining steadily since June, suggesting that sellers are pricing more strategically or that buyer demand is stabilizing alongside improved affordability.
Photos Courtesy of Compass
Rising Homeowner Insurance Costs
Another notable trend this year has been the sharp rise in homeowner’s insurance premiums. Across most states, average annual costs for $300,000 in coverage have climbed rapidly and are expected to continue doing so. Rates vary dramatically by region, influenced by local construction costs, weather risk, and regulatory factors.
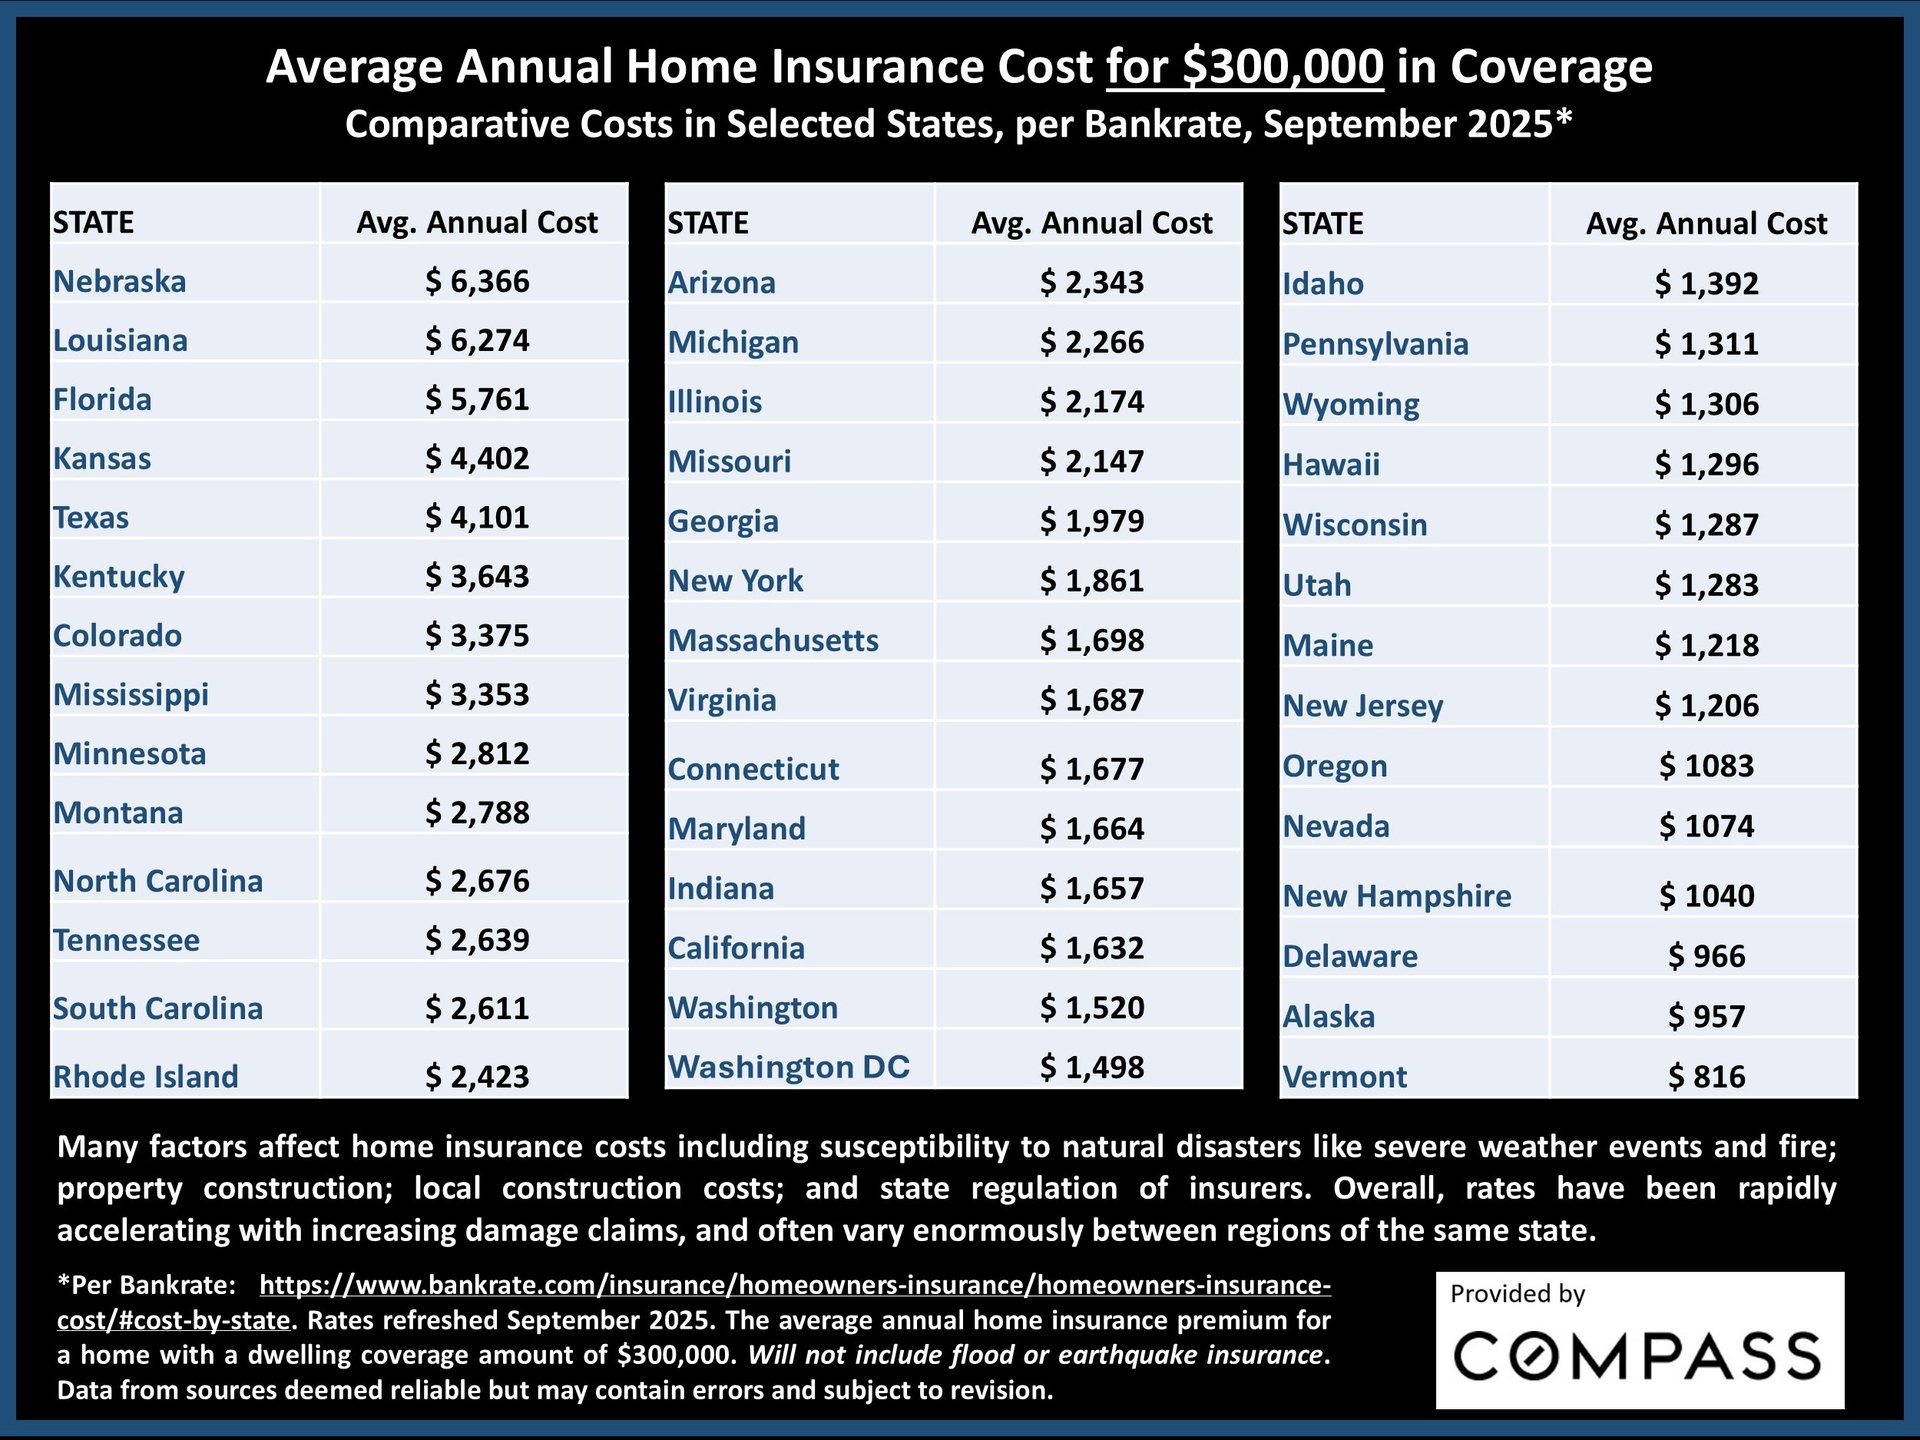
Photo Courtesy of Compass
Looking Ahead
With interest rates dropping, stock market confidence holding steady, and buyers re-engaging across many markets, Q4 could see renewed momentum—especially in the single-family home sector. While affordability and insurance costs remain challenges in some regions, overall trends suggest a more balanced, opportunity-rich market heading into 2026.
At The Blackshaw Messel Group, we stay on top of these evolving trends to help our clients make confident, informed decisions. Whether you’re planning to buy, sell, or simply want to understand how these shifts may impact your goals, our team is here to help you navigate the changing market with clarity and strategy.

Photo Courtesy of Something Blue Photography